Fig. 1.
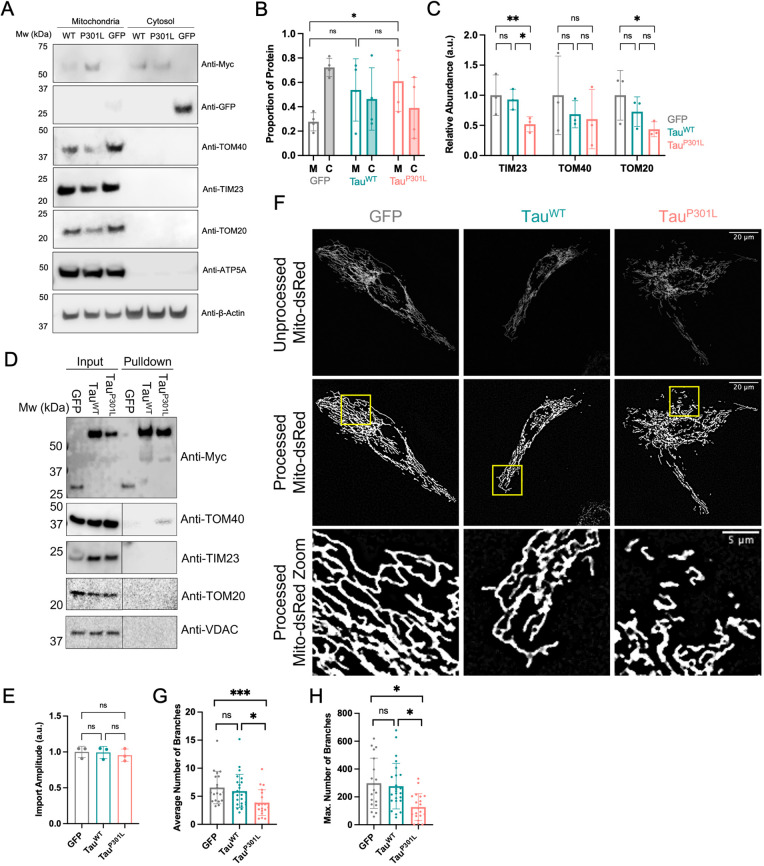
TauP301L associates with the mitochondrial translocation machinery and alters mitochondrial morphology. (A) Representative western blots showing relative protein abundance in mitochondrial and cytosolic fractions of HeLaGAL cells producing GFP, Myc–TauWT or Myc–TauP301L (following lentiviral infection). Localisation of GFP, TauWT and TauP301L was analysed by probing for GFP (Sigma; G1544; 1:1000) and Myc (CST; 2276; 1:5000). Translocase subunit abundance was analysed by probing for TOM40 (Thermo Fisher Scientific; PA5-57575; 1:1000), TIM23 (Invitrogen; PA5-71877; 1:1000) and TOM20 (Santa Cruz Biotechnology; sc-17764; 1:500). ATP5A (Abcam; 15H4C4; 1:1000) and β-actin (Sigma; A2228; 1:10000) were used as loading controls for the mitochondria and cytosol, respectively. N=4 (GFP/Myc) and N=3 (translocases) biological replicates. (B) Quantification of the proportion of GFP, TauWT or TauP301L in mitochondrial (labelled M) and cytosolic (labelled C) fractions of HeLaGAL cells. Band intensity values were first normalised to their respective mitochondrial/cytosolic loading controls, summed to obtain the ‘total’ abundance, and the mitochondrial/cytosolic fraction was determined as a proportion of the total (mitochondrial/total or cytosolic/total). Error bars show s.d. One-way ANOVA and Tukey's post hoc test were used to determine significance. P-values (left to right, bottom to top): >0.9999, 0.5648, 0.0135. (C) Quantification of the relative abundance of translocase subunits (TIM23, TOM40 and TOM20) in HeLaGAL cells over-producing GFP, TauWT or TauP301L. Normalised to loading controls. Error bars show s.d. One-way ANOVA and Tukey's post hoc test were used to determine significance. P-values (left to right, bottom to top): TIM23: 0.0538, 0.0273, 0.0014; TOM40: 0.4785, 0.9474, 0.3362; TOM20: 0.2166, 0.3810, 0.0356. (D) Representative western blot showing TOM40 association with TauP301L, but not with Myc-tagged GFP or TauWT, in the mitochondrial fraction of HeLaGAL cells. Mitochondria were isolated from HeLaGAL cells over-producing Myc–GFP, Myc–TauWT or Myc–TauP301L and proteins were solubilised gently with GDN (input) before immunoprecipitation using Myc-trap beads (Chromotek). Eluted proteins (pulldown) were analysed by western blotting and probed against Myc (to validate IP) and TOM40, TIM23, and TOM20, to observe possible association of Tau variants with import machinery. VDAC (Invitrogen; PA1-954A; 1:1000) was used as a mitochondrial loading control. The input represents 25% of the lysate used in the pulldown. The input and pulldown samples were run on the same gel, but a higher exposure was used for the pulldown for TOM40, TOM20, TIM23 and VDAC blots, to detect low levels of binding. This is highlighted by a line in the respective panels, and both low and high exposures are shown in Fig. S4. N=3 biological replicates. Quantification of the TOM40–Tau interaction is shown in Fig. S1B. (E) Maximum import amplitude from MitoLuc import assay on HeLaGAL cells over-producing GFP, TauWT or TauP301L. Bars represent the relative maximum mitochondrial import of the precursor protein Su9-EGFP-pep86 [normalised to eqFP670 expression, maximum amplitude for run, and control (GFP)]. N=3 biological repeats, each with n=3 technical replicates. Error bars display s.d. One-way ANOVA with Tukey's post hoc test was used to determine significance. Import traces are shown in Fig. S1C. P-values (left to right, bottom to top): 0.9997, 0.9568, 0.9492. (F) Representative confocal images showing mitochondrial morphology in HeLaGAL cells expressing mito-dsRed and GFP (left, grey), TauWT (middle, teal) or TauP301L (right, pink). The top panel shows mito-dsRed (mitochondria) before processing. The middle panel shows mitochondria after processing, and the bottom panel shows a zoom of an area of mitochondria (highlighted in the middle panel yellow box) to give a clear view of mitochondrial morphology. N=5 biological repeats. (G) Quantification of the average number of mitochondrial branches in a network. Nested one-way ANOVA and Tukey's post hoc test were used to determine significance. Statistics were carried out on N=5 biological replicates. Each point on the graph represents an individual cell to display the spread of the data (20, 24, and 23 cells were counted for each condition, respectively). Error bars show s.d. P-values (left to right, bottom to top): 0.2624, 0.0345, 0.0004. (H) Quantification of the maximum number of mitochondrial branches in a network. Statistical analysis is exactly as described in G. P-values (left to right, bottom to top): 0.9886, 0.0395, 0.0321. ns, P>0.05, *P≤0.05, **P≤0.01, ***P≤0.001. a.u., arbitrary units.

