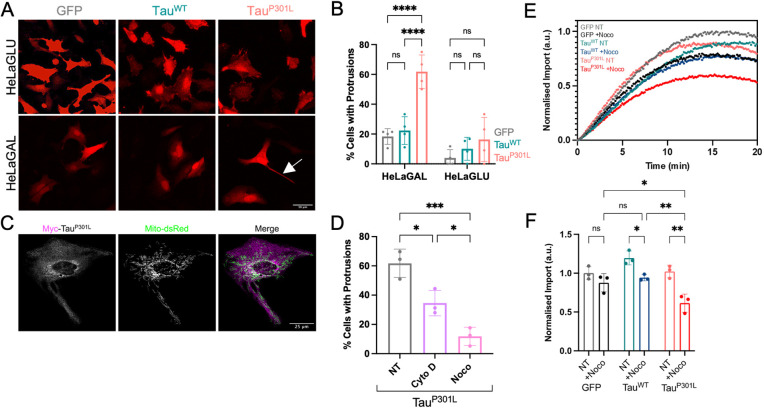
Fig. 2.
HeLaGAL cells over-producing TauP301L form TNTs that contain mitochondria. (A) Representative confocal images demonstrating the cell morphology of HeLaGLU or HeLaGAL cells subjected to over-production of mCherry (red) as well as GFP, TauWT, or TauP301L. The white arrow in the bottom right panel indicates a TNT. N=4 biological replicates. (B) Quantification of the proportion of cells with protrusions from representative images shown in A. Error bars show s.d. Two-way ANOVA and Šidák's multiple comparison tests were used to determine significance. N=4 biological replicates, 20 cells were counted per replicate. P-values (left to right, bottom to top): HeLaGAL, 0.9145, <0.0001, <0.0001; HeLaGLU, 0.7546, 0.7435, 0.2265. (C) Representative confocal images showing mitochondrial localisation (mito-dsRed; green) in cells over-producing Myc–TauP301L [magenta; anti-Myc (Cell Signalling Technologies; 2276; 1:1000)]. N=4 biological replicates. (D) Quantification of the percentage of HeLaGAL cells with protrusions following TauP301L over-production in the presence of TNT inhibitors. HeLaGAL cells were subjected to over-production of TauP301L–mScarlet and either untreated (NT; DMSO only) or treated with 50 nM cytochalasin D or 100 nM nocodazole for 48 h. N=3 biological replicates, 20 cells counted per replicate. Error bars show s.d. One-way ANOVA and Tukey's post hoc test were used to determine significance. Representative images are shown in Fig. S2B. P-values (left to right, bottom to top): 0.0169, 0.0357, 0.0008. (E) MitoLuc import traces showing the impact of the TNT inhibitor nocodazole on the import of a precursor protein in HeLaGAL cells over-producing Tau variants. Cox8a-11S-producing cells were transfected with GFP, TauWT or TauP301L in the presence (+Noco) or absence (NT) of 100 nM nocodazole for 48 h before monitoring the import of Su9-EGFP-pep86 by MitoLuc import assays. N=3 biological replicates. Data are normalised to the maximum signal. (F) Quantification of import amplitude for import traces shown in Fig. 2E. Data are normalised to untreated GFP control. Error bars represent s.d. Two-way ANOVA with Tukey's post hoc test was used to determine significance. P-values (left to right, bottom to top): 0.5819, 0.0474, 0.0016, 0.9457, 0.0092, 0.0401. ns, P>0.05, *P≤0.05, **P≤0.01, ***P≤0.001; ****P≤0.0001. a.u., arbitrary units.

