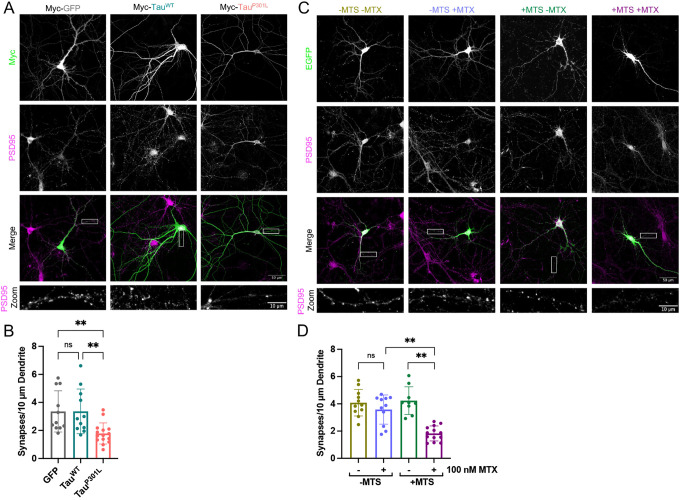
Fig. 4.
TauP301L and precursor trapping reduce synapse abundance. (A) Representative confocal images showing synaptic staining of DIV21 primary hippocampal neurons over-producing Myc-tagged GFP, TauWT or TauP301L (Myc; green; Cell Signaling Technologies 2276; 1:1000). PSD95 staining shows synapses (magenta; second panel from the top, also shown in the zoom; EMD Millipore AB1596; 1:400). N=5 biological replicates. (B) Quantification of the average number of synapses per 10 µm dendrite for GFP, TauWT and TauP301L over-producing neurons. Synapses were counted manually on anonymised data. Each data point represents an individual cell. Error bars show s.d. Nested one-way ANOVA and Tukey's post hoc test were used to determine significance. P-values (left to right, bottom to top): >0.9999, 0.0098, 0.0100. (C) Representative confocal microscopy images showing synaptic staining of DIV21 primary hippocampal neurons over-producing EGFP–DHFR (−MTS) or Su9-EGFP–DHFR (+MTS; EGFP shown in green, top panels) in the absence or presence of 100 nM MTX (±MTX). PSD95 staining shows synapses (magenta, second panel from the top, also shown in the zoom; EMD Millipore AB1596; 1:400). N=5 biological replicates. (D) Quantification of the average number of synapses per 10 µm dendrite for neurons over-producing EGFP–DHFR (−MTS) or Su9-EGFP–DHFR (+MTS) in the presence or absence of 100 nM MTX. Synapses were counted manually on anonymised data. Each data point represents an individual cell. Error bars show s.d. Nested one-way ANOVA and Tukey's post hoc test were used to determine significance. P-values (left to right, bottom to top): 0.8172, 0.0015, 0.0090. ns, P>0.05, **P≤0.01.

