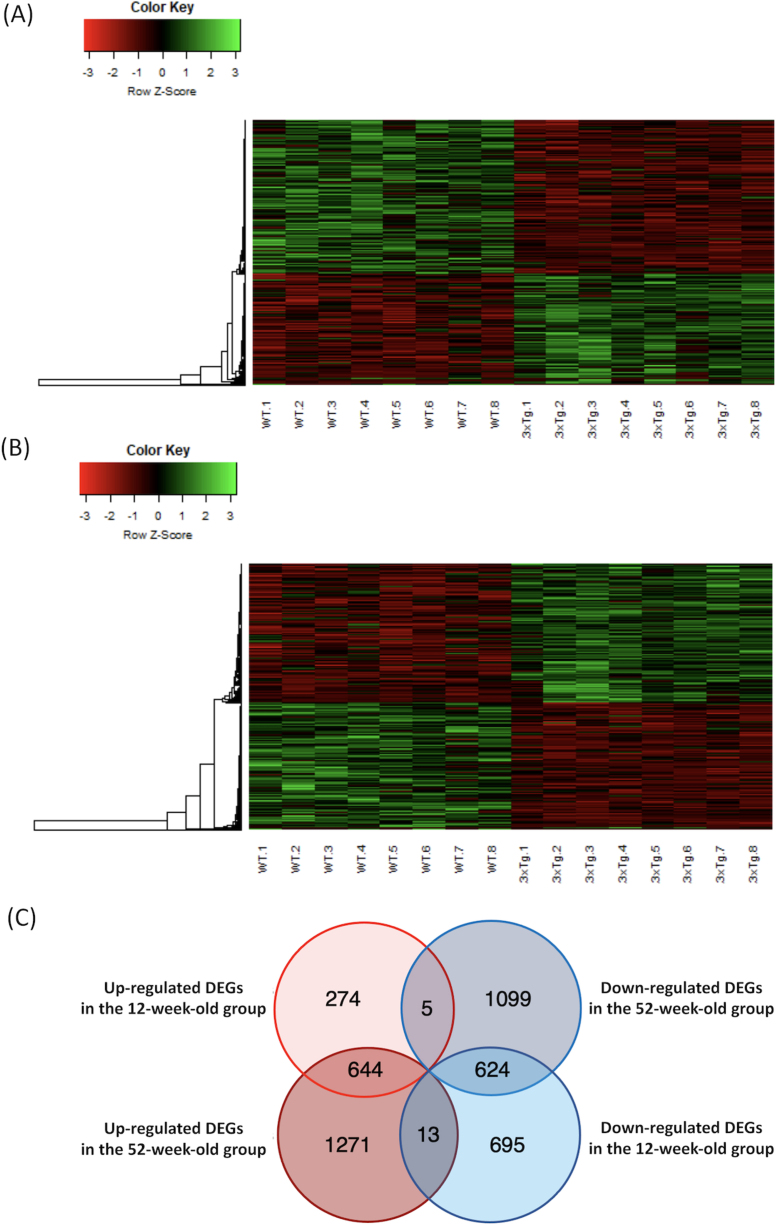
Fig. 1.
Heatmap of the microarray data, and Venn diagram of the overlapping DEGs in each group. A) The microarray data of DEGs in the 12-week-old group were plotted as a heatmap. High-expression DEGs are shown in red, and low-expression DEGs are shown in green. B) The microarray data of DEGs in the 52-week-old group were plotted as a heatmap. C) The number of DEGs that overlapped in each group are shown in the Venn diagram. DEGs, differentially expressed genes; WT, wild-type mice; 3xTg, 3xTg-AD model mice.

