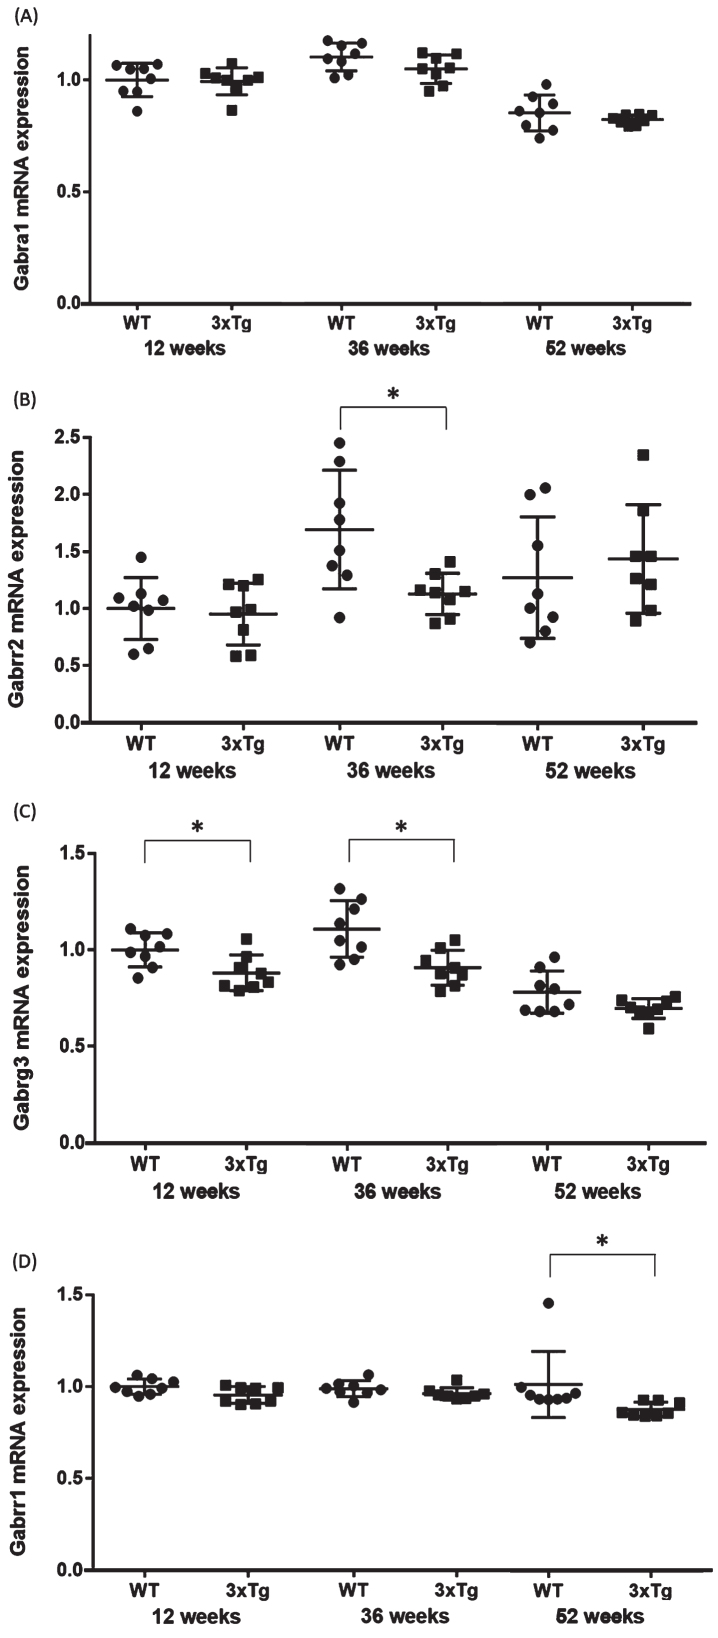
Fig. 4.
Validation qPCR of the four genes associated with the GABA signaling pathway. Comparison of the (A) Gabra1, (B) Gabrr2, (C) Gabrrg3, and (D) Gabrr1 mRNA expression levels between WT and 3xTg mice. The y axis represents the relative expression level (/WT mice at 12-week-old) from the qPCR results. Student’s t-test or the Mann-Whitney U test were used to compare the average mRNA expression levels between the WT and 3xTg mice. Statistical significance was defined at p = 0.05. The horizontal bars represent the means±standard error. *p < 0.05. WT, wild-type mice; 3xTg, 3xTg-AD model mice.

