Fig. 1.
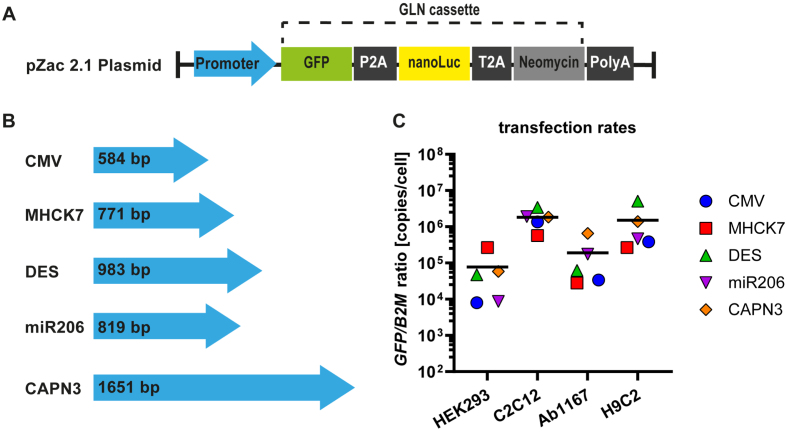
Muscle specific promotors and plasmid transfection ratios. (A) The pZac2.1 plasmid containing the respective promotor sequence and the GLN expression cassette. (B) Four muscle specific promotors (MHCK7, DES, miR206 and CAPN3) were tested and compared to a ubiquitous promotor (CMV). Blue arrows represent the relative lengths of promotor sequences. (C) Plasmid transfection protocols were adjusted for HEK293, C2C12, HSKM-Ab1167 and H9C2 cell types and transfection ratios were measured by qPCR for tEGFP in relation to B2M housekeeping gene. Scatter dot plot shows mean GFP/B2M ratios of the respective reporter plasmids in the given cell types (n = 4). Black lines indicate the overall mean of reporter plasmid transfection rates in each cell line.

