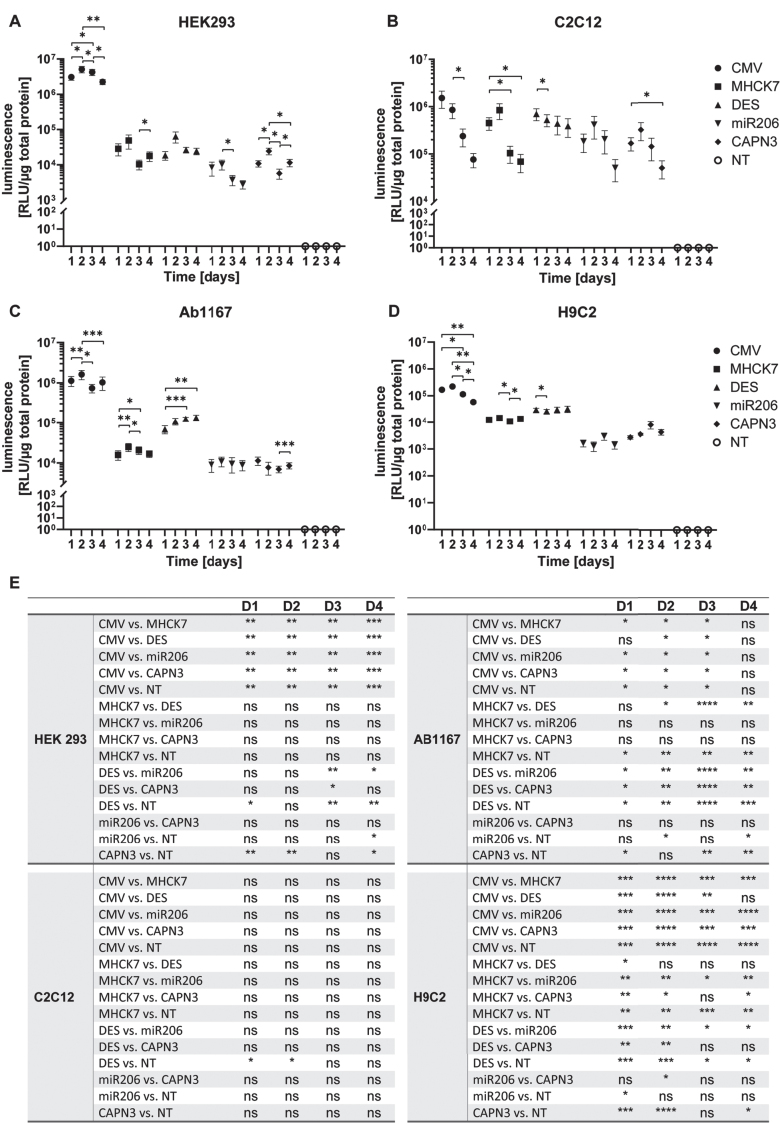
Fig. 3.
Promotor activity and specificity measured by luciferase assay in different proliferating cell types. (A–D) Proliferating HEK293 (A), C2C12 (B), HSKM-Ab1167 (C) and H9C2 (D) were transfected with the constructs encoding luciferase under control of respective promotors. Luciferase activity was measured on day 1, 2, 3 and 4 post transfection. All samples were normalized to 1μg total protein and datapoints represent mean values±SEMs using a log10 scale (n = 4). Asterisks represent significant differences over 1–4 days within each promotor group (*p < 0.05; **p < 0.01; ***p < 0,001). (E) Overview of all significant differences (*p < 0.05; **p < 0.01; ***p < 0,001; ****p < 0,0001; ns = not significant) derived by the promotor driven luciferase activity at day 1, 2, 3 and 4, respectively.

