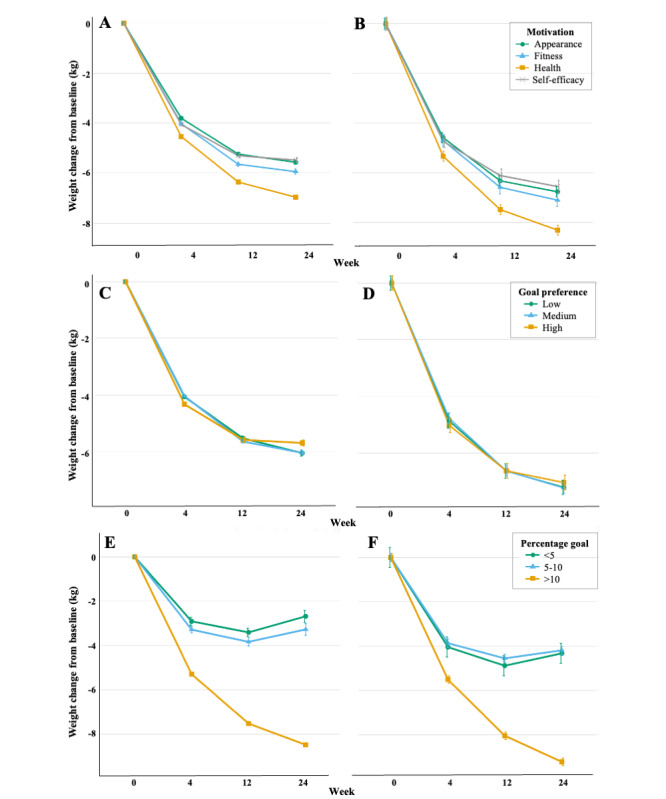
Figure 3.

Mean adjusted weight change by (A) weight loss motivation using all available data (n=28,391), (B) weight loss motivation for completers (n=2514), (C) goal preference using all available data (n=26,158), (D) goal preference for completers (n=2194), (E) percentage weight loss goal using all available data (n=28,391), and (F) percentage weight loss goal for completers (n=2514). Weight change (kg) at 4, 12, and 24 weeks were calculated from mixed effects models, adjusted for age, sex, Index of Multiple Deprivation, and type 2 or prediabetes. Values represent mean (SE).
