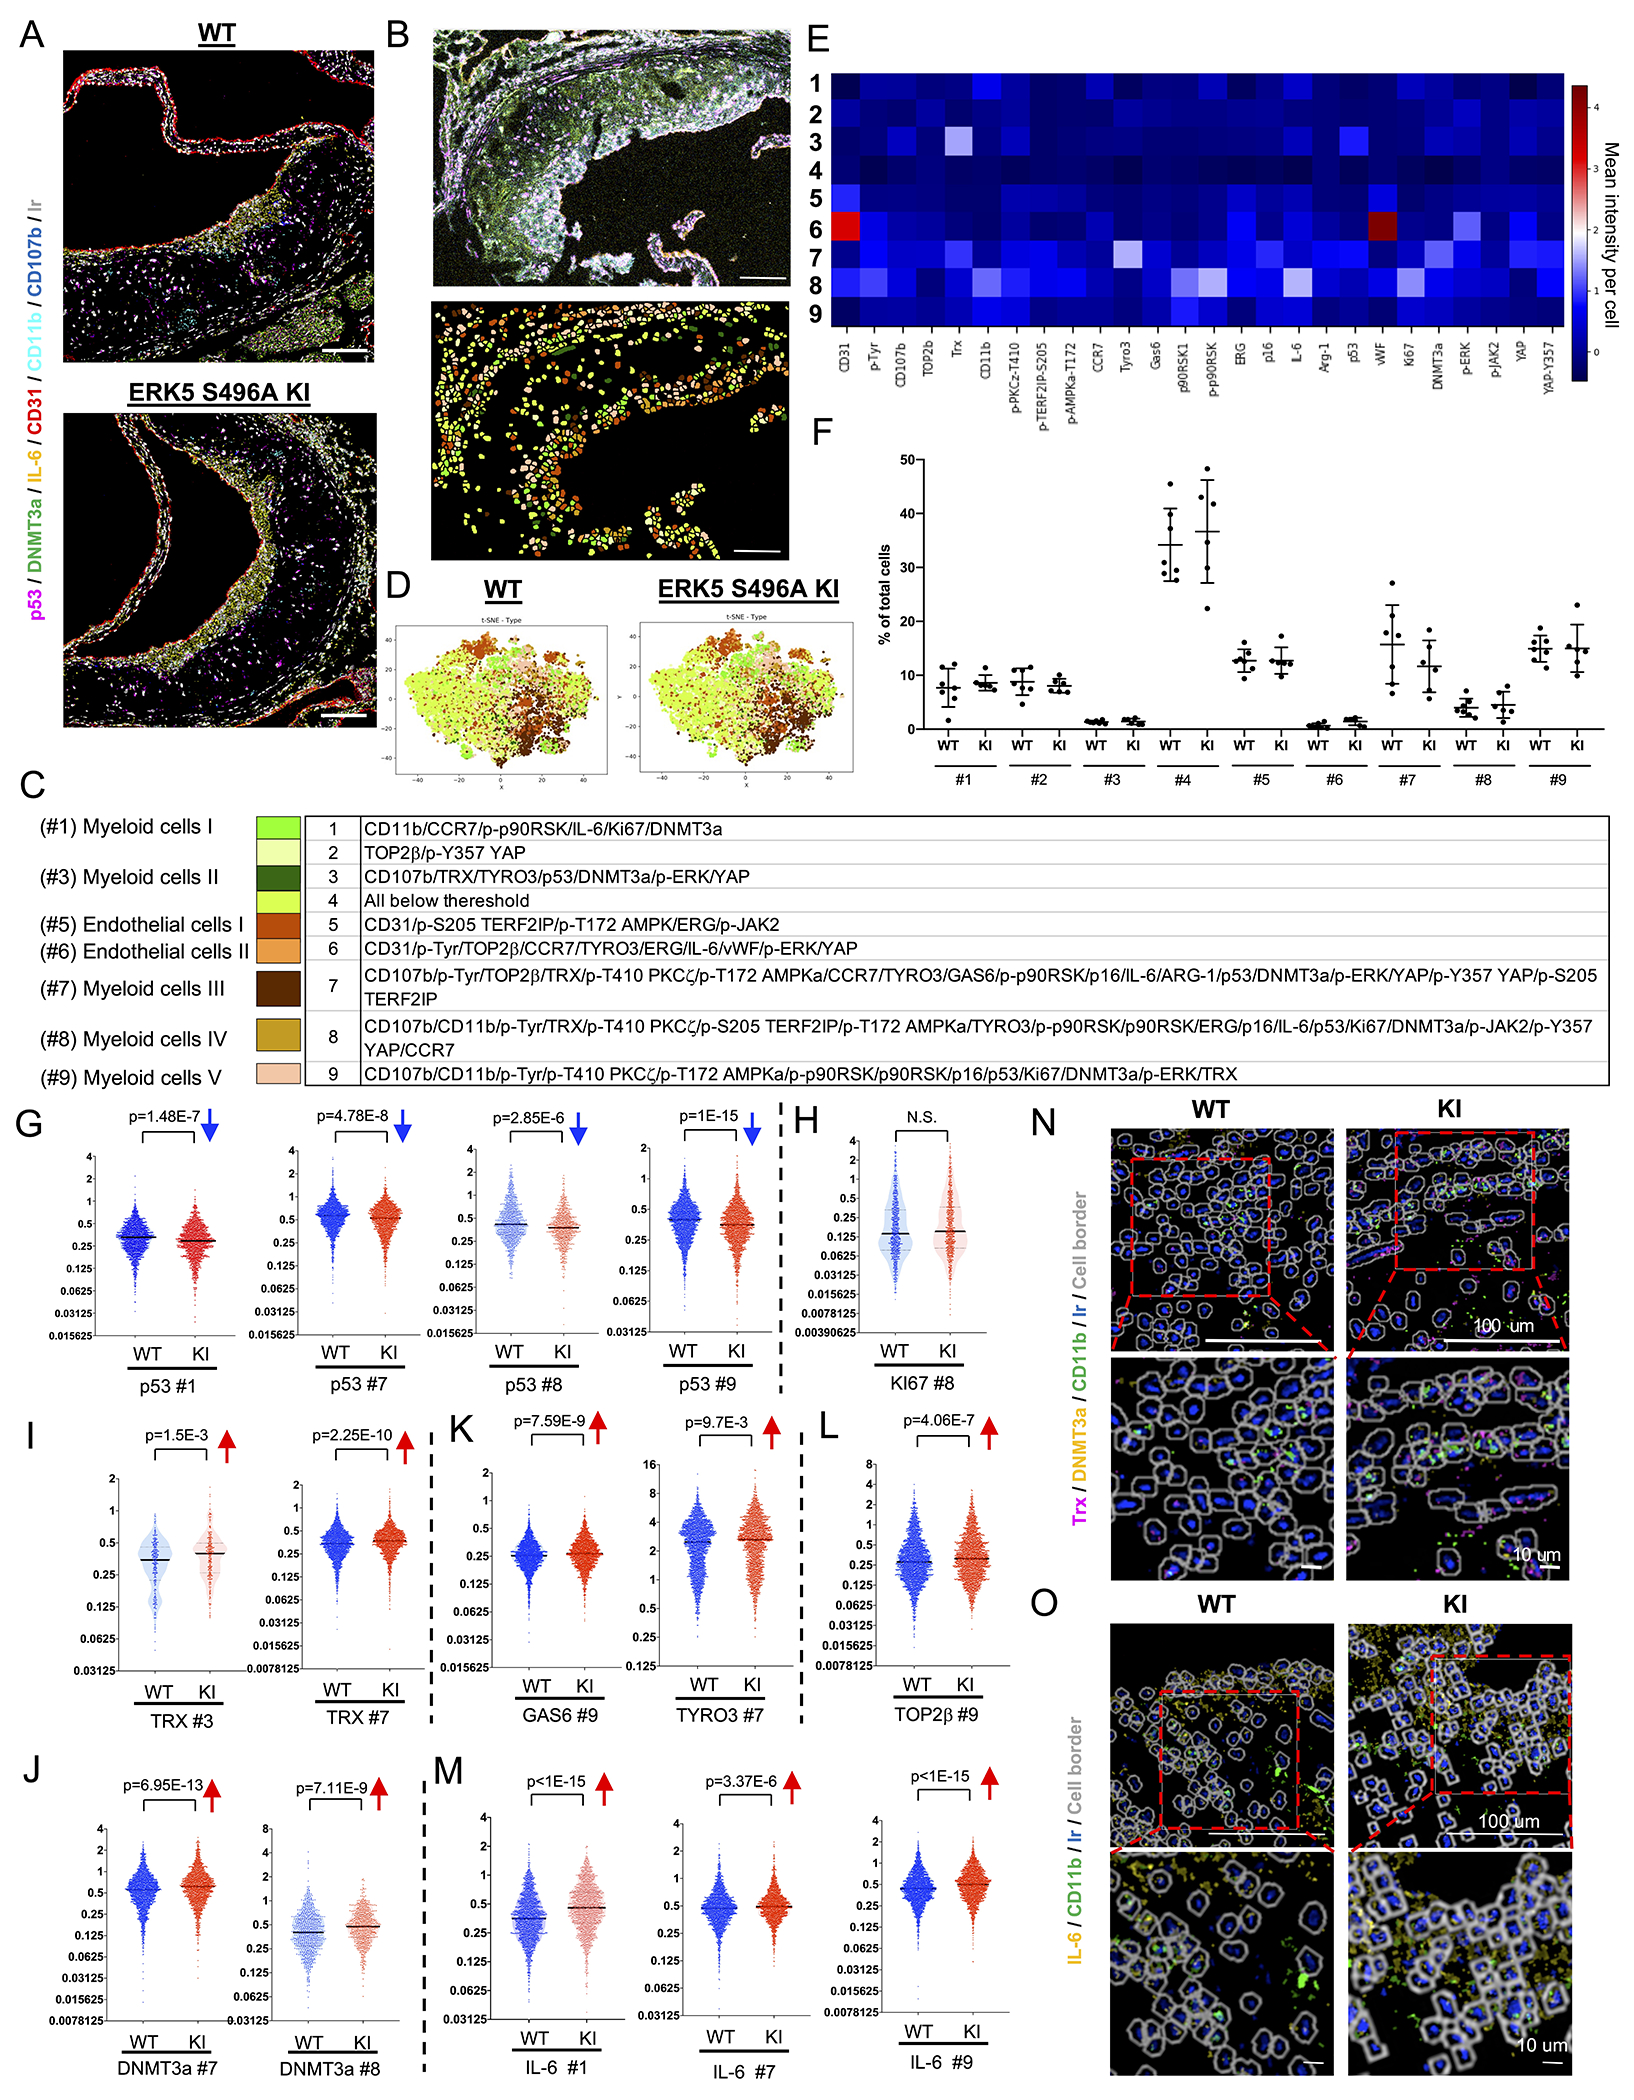
Figure 2. Single cells-based clustering by imaging mass cytometry and SASP markers in WT and ERK5 S496A KI plaques in vivo.

(A) Six transient and single isotope signals from the markers and the Ir DNA-Intercalator signal were plotted. (B, upper) IMC analysis of tissues sectioned from WT and ERK5 S496A KI plaques. All 26 transient and single isotope signals from the markers and the Ir DNA-Intercalator signal were plotted. (B, lower, and C) After cell segmentation and phenotyping, 9 phenotypic clusters were identified in WT and ERK5 S496A KI plaque tissues. Each color indicates a cell cluster in C. (D) t-SNE plots of WT and ERK5 S496A KI plaque tissues. (E) Heatmap with 9 phenotypic clusters showed differentially regulated 26 molecules. (F) Cell number (%) in each cluster of total cells in each region of interest (ROI). We measured 18 ROIs from 7 WT samples and 18 ROIs from 6 ERK5 S496A KI samples and averaged the values from the same sample (n=7, 6). Data are expressed as mean±SD. Statistical significance was assessed by one-way ANOVA, and showed no difference between WT and ERK5 S496A KI. (G-M) The single-cell expression level of each marker in MC-like clusters between WT and ERK5 S496A KI plaque tissues. p53 expression levels in #1, #7, #8, and #9 were decreased in ERK5 S496A KI cells compared to in WT cells (G). Ki67 expression in the most inflammatory MC-like cluster (#8) was not changed between WT and ERK5 S496A KI cells (H). TRX expression levels in #3 and #7; DNMT3a in #7 and #8; TYRO3 in #7; GAS6 and TOP2β in #9; and IL-6 in #1, #7, and #9 were increased in ERK5 S496A KI cells compared to in WT cells (I-M). The Y-axis indicates the mean intensity, and solid black lines indicate the median value in each violin plot. (N, O) Staining images of each marker acquired by IMC were exported by the MCD viewer and merged with cell border images (gray) exported from VIS software. Ir (blue) is DNA. Upper images are low magnification (scale bar=100 μm), and lower images are high magnification (scale bar=10 μm). (N) Trx (magenta) and DNMT3a (yellow) in CD11b (lime)-positive myeloid cells were induced in ERK5 S496A KI compared to WT cells. (O) IL-6 (yellow) in CD11b (lime)-positive myeloid cells was induced in ERK5 S496A KI compared to WT cells. The applied statistical tests, sample number, and results in all figures are summarized in Table S3.
