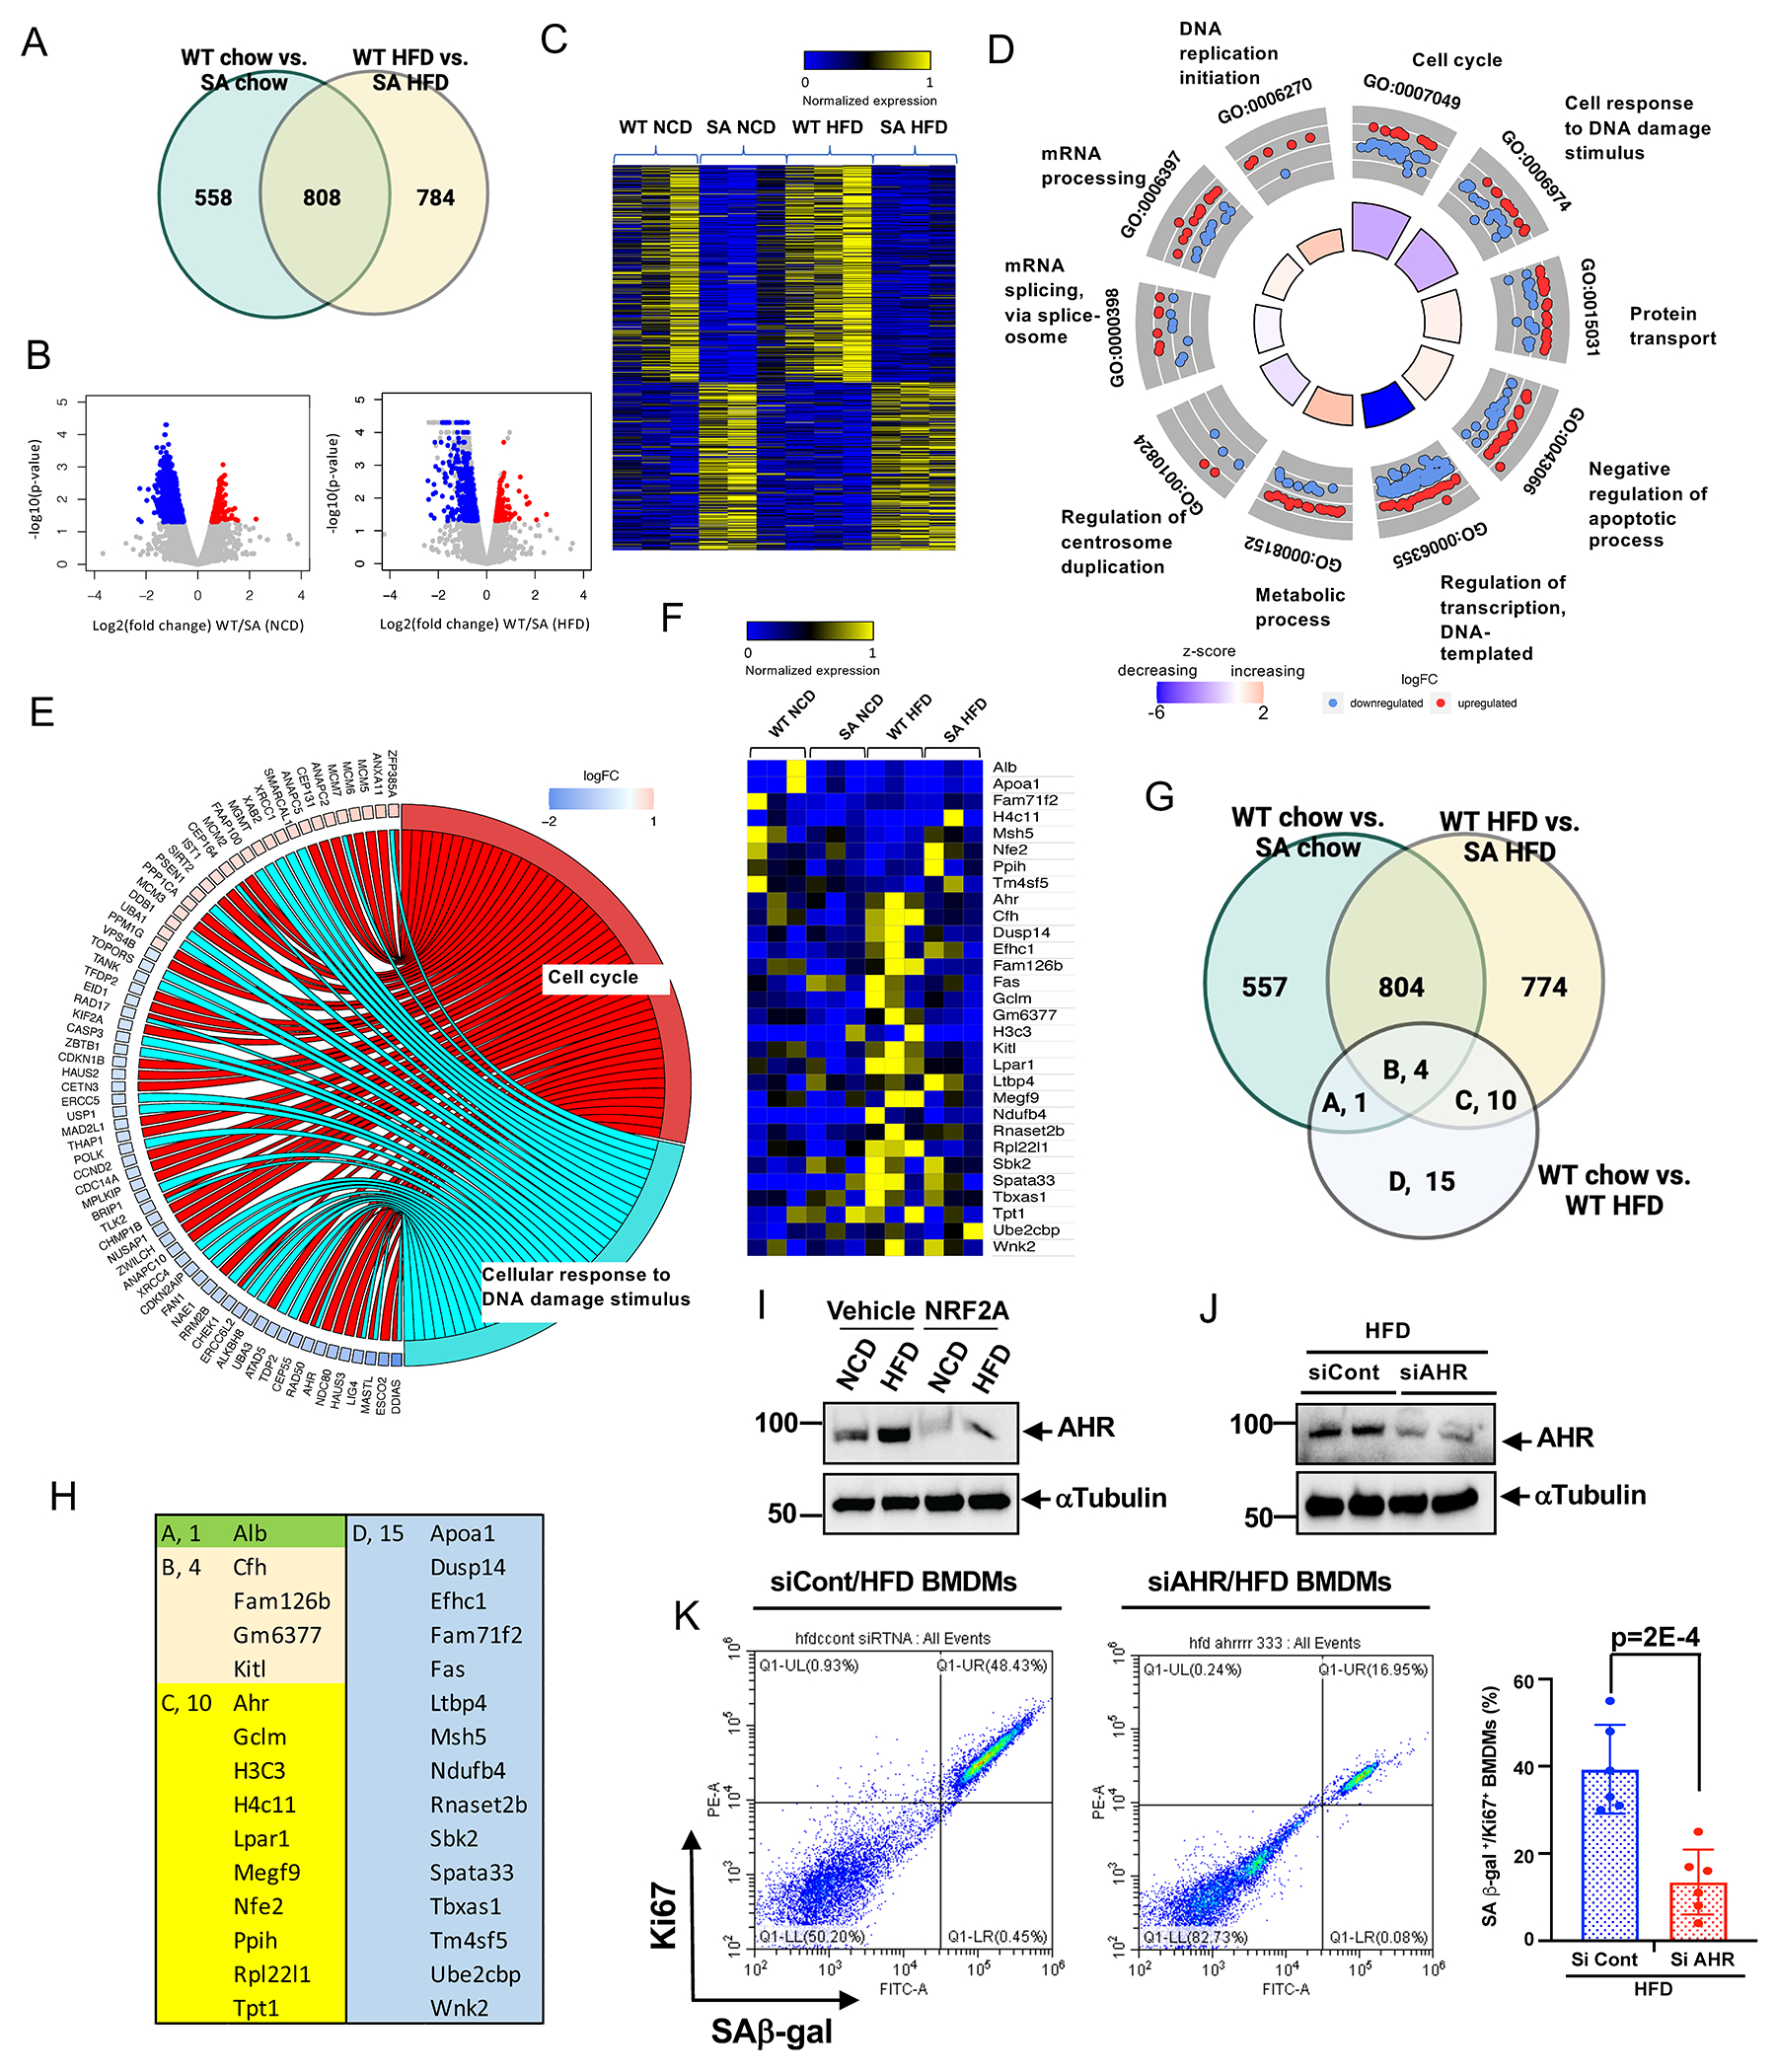
Figure 4. ERK5 S496 phosphorylation regulates the genetic profile of HC-mediated reprogrammed MCs and the critical role of AHR on SAS ex vivo.

(A) Venn diagram illustrating the gene expression patterns in each experimental group. (B) Volcano plot of BMDMs from WT and ERK5 S496A KI fed a normal chow diet (NCD) or high fat diet (HFD) RNA-seq adjusted p-value < 0.01, 1039 genes upregulated and 327 downregulated in WT vs. SA NCD, and 1174 genes upregulated, and 418 downregulated in WT vs. SA HFD. 3 samples/group. (C) Heatmap differentially regulated 784 genes only between WT HFD and ERK5 S496A KI HFD (SA HFD). (D) Functional enrichment analyses. GOcircle plots display scatter plots of log fold change (logFC) for selected GO terms. Red dots represent upregulated genes, and blue dots represent downregulated genes. The inner circles display z-scores calculated as the number of up-regulated genes minus the number of down-regulated genes divided by the square root of the count for a WT HFD and ERK5 S496A KI HFD. Up-regulated means that expression is higher in the ERK5 S496A KI HFD. (E) Circle plot of select genes indicated ontologies. Gene expression relative difference (log2 fold change). (F) Heatmap differentially regulated 30 genes only between WT NCD and WT HFD (WT HFD). (G) Venn diagram including the genes listed in E, and (H) the list of the genes. (I) AHR expression in BMDMs from WT fed a NCD or HFD after 24 hours of the vehicle or NRF2-KEAP1-binding inhibitory peptide, CAS 1362661 (NRF2A; 2 μM) treatment. (J) AHR expression in BMDMs from WT fed a HFD after AHR siRNA or control siRNA transfection. (K) Co-expression of the fluorescent SA-β-gal marker and Ki67 in BMDMs isolated from WT HFD after transfection of control siRNA and AHR siRNA Graph showed % of double-positive cells of SA-β-gal and Ki67. The applied statistical tests, sample number, and results in all figures are summarized in Table S3. Mean±SD, **P<0.01.
