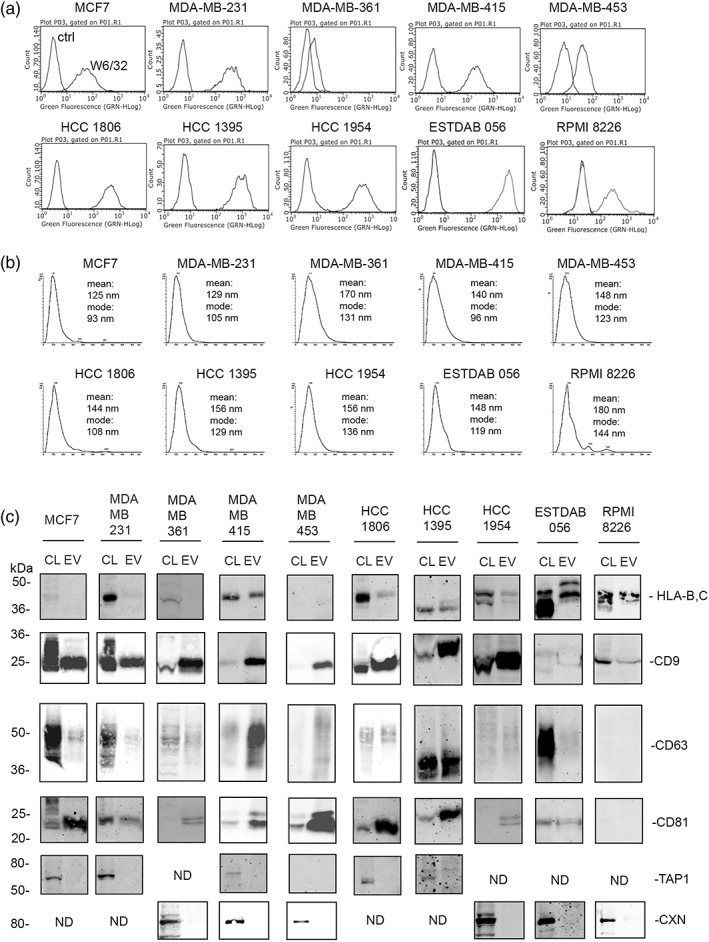
FIGURE 1.

(a) Flow cytometry of cell surface HLA‐A, B, and C as detected by antibody W6/32 compared to control second‐stage FITC anti‐IgG alone (ctrl). (b) NTA analysis of particles released by cell lines. One comparative graph of three recordings is shown, with mean and modes indicated. (c) Immunoblotting analysis of detergent cell lysates (CL) and EV lysates of all cell lines, probed for HLA‐B and C, CD9, CD63, CD81, and control proteins transporter associated with antigen processing (TAP1) and calnexin (CXN)
