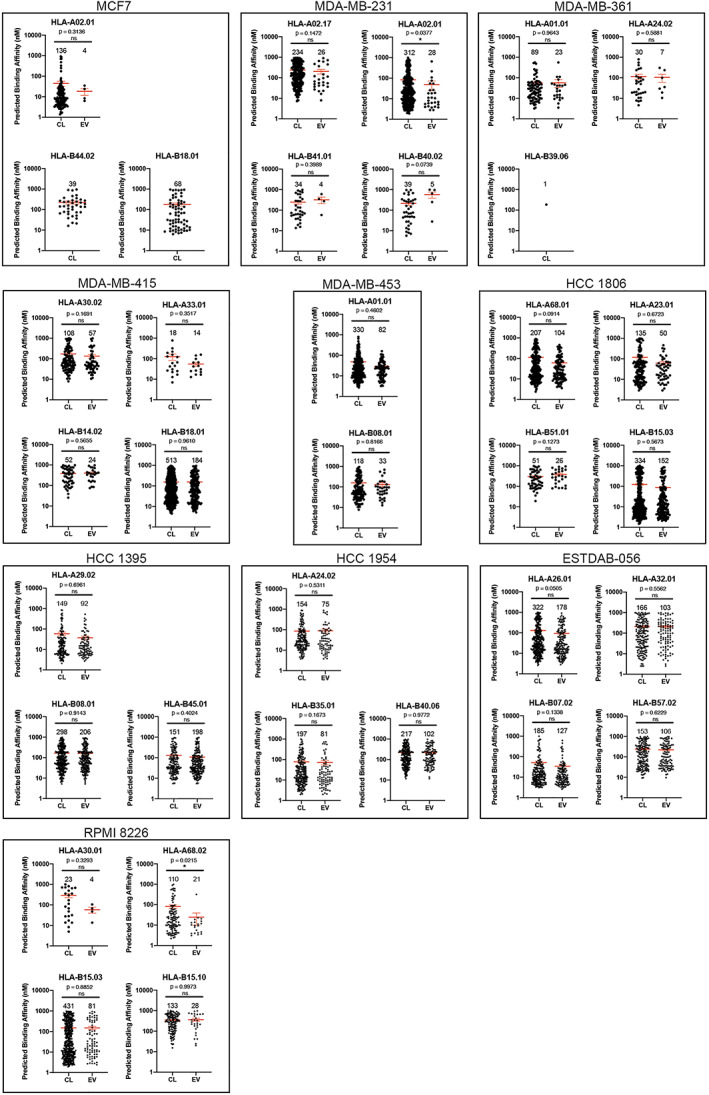
FIGURE 2.

Predicted HLA‐A‐ and B‐binding affinities of peptides from cells (CL) and EV, determined using algorithm netMHCpan 4.0. Each dot represents a single identified peptide. The numbers above each plot indicates the number of ligands for each respective HLA‐I allele. Two‐tailed Mann–Whitney test was performed, with mean predicted affinity ± SE shown in red. ns, not significant; *p < 0.05
