
FIGURE 2.
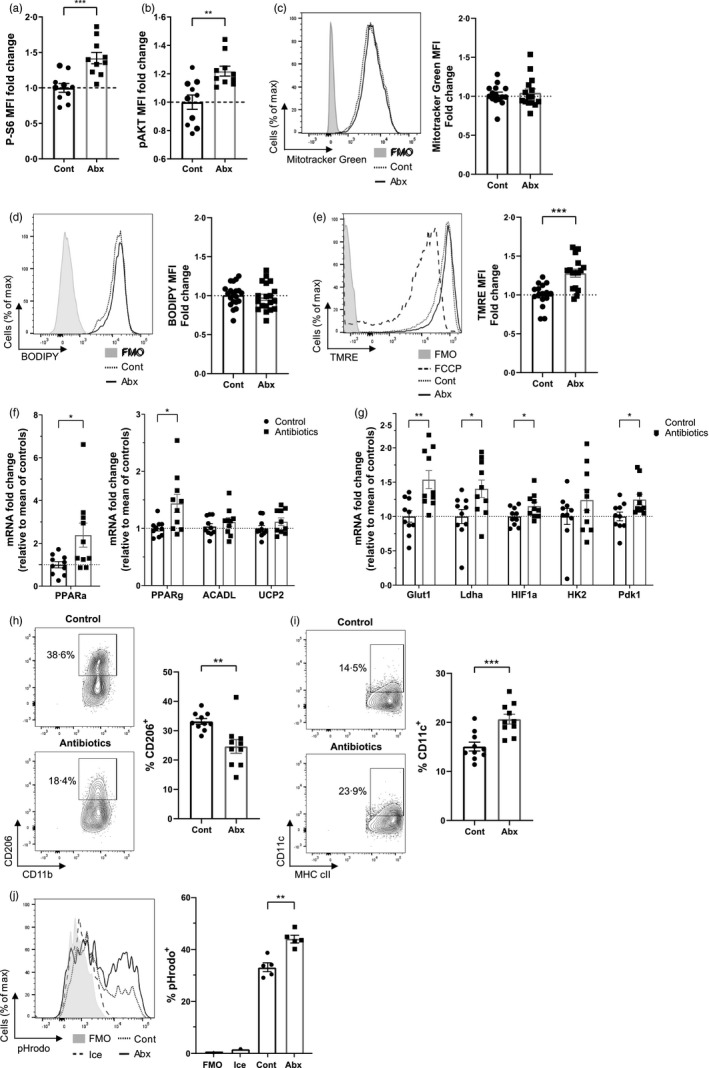
Antibiotics alter the metabolism of macrophages within the large intestine. Mice were treated with antibiotic or control water and large intestinal cell suspensions isolated. (a–e) Macrophages (live CD45+SiglecF−Ly6G−CD11b+CD64+Ly6C−MHC cII+) were identified by flow cytometry for gating. (a, b) Phosphoflow for phosphorylated serine‐6‐kinase (a) and phosphorylated AKT (b). Fold change is normalized to control samples; n = 10. (c) Cells were treated with 50 nm Mitotracker Green and staining measured at 530 nm. n = 10. (d) Cells were treated with 5 µm BODIPY FL C16 in fatty acid‐free media, and uptake measured at 530 nm, n = 19–20. (e) Cells were treated with 25 nm of TMRE and fluorescence measured at 586 nm. n = 16. (f, g) Large intestinal monocyte‐macrophages (live CD45+SiglecF−Ly6G−CD11b+CD64+) were sorted by flow cytometry, and mRNA expression of glycolytic‐related (f) and oxidative phosphorylation‐related (g) genes was quantified by real‐time PCR. Fold change is relative to mean of control samples; n = 10. (h, i) CD206 (h) and CD11c (i) expression and on Ly6C−MHCcII+ macrophages by flow cytometry; n = 10. (j) Cell suspensions were analysed with the pHrodo phagocytosis assay and uptake on macrophages measured at 561 nm; n = 5.*p < 0·05, **p < 0·01, ***p < 0·001, Student's t‐test