
FIGURE 4.
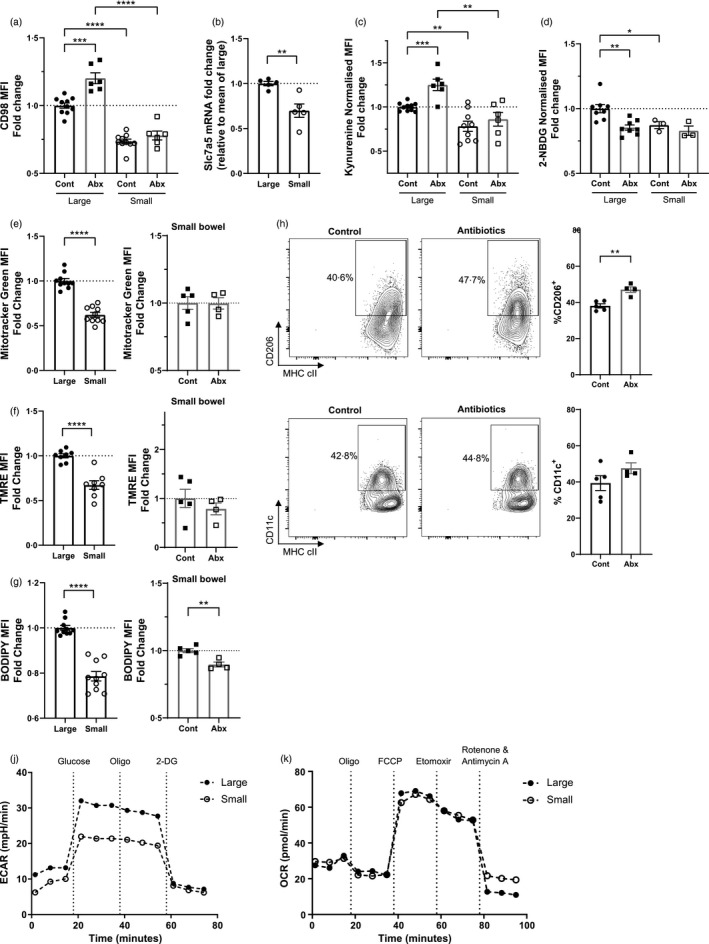
Small intestinal macrophages are less metabolically active, and less metabolically dependent on the gut microbiota. Mice were treated with antibiotic or control water and intestinal monocytes‐macrophages (live CD45+Ly6G−CD11b+CD64+) were identified from the large or small bowel by flow cytometry. (a) Mean fluorescent intensity (MFI) of CD98 protein expression on intestinal macrophages (Ly6C−MHC cII+). Fold change is normalized to mean of large control; n = 6–10. (b) Relative mRNA expression of Slc7a5 on sorted Ly6C−MHC cII+ macrophages. n = 5. (c) Intestinal cell suspensions were treated with kynurenine and cell uptake measured on Ly6C−MHC cII+ intestinal macrophages at 450 nm. MFI readings were normalized to background. Fold change is relative to the mean of the large control group; n = 6–10. (d–g) Intestinal cell suspensions were treated with (d) 2‐NBDG, (e) Mitotracker Green, (f) TMRE or (g) BODIPY FL C16 and cell uptake measured on Ly6C−MHC cII+ intestinal macrophages at 530 or 561 nm. MFI readings were normalized to background. Fold change is relative to the mean of the large control groups; n = 3–10. (h–i) CD206 (h) and CD11c (i) expression and on Ly6C−MHCcII+ macrophages by flow cytometry; n = 4–5. (j) Extracellular acidification rate (ECAR) was measured after addition of 25 mm glucose, 2 µm oligomycin and 50 mm 2‐Deoxy‐d‐glucose (2‐DG). (K) Oxygen consumption rate (OCR) was measured after addition of 2 µm oligomycin, 1·5 µm carbonyl cyanide‐4‐(trifluoromethoxy) phenylhydrazone (FCCP), 200 µm etomoxir and 100 nm rotenone and 1 µm antimycin A. *p < 0·05, **p < 0·01, ***p < 0·001, ****p < 0·0001, Student's t‐test