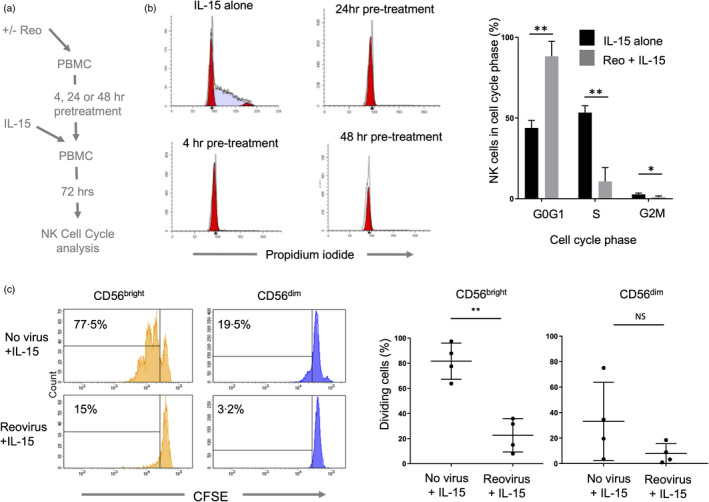
FIGURE 4.

Inhibition of NK cell proliferation following reovirus treatment. (a) Summary of the approach. PBMC were pre‐treated with/without reovirus for 4, 24 or 48 h and IL‐15 (10 ng/ml) was then added for 72 h, after which cell cycle profiling was performed. (b) Cell cycle profiling by DNA content. PBMC were treated with either 10 ng/ml IL‐15 for 72 h, or pre‐treated with 1 MOI reovirus for 4, 24 or 48 h, followed by IL‐15 treatment for 72 h. NK cells were purified, fixed and DNA stained with propidium iodide and analysed by flow cytometry. Cell cycle profiles were analysed using Modfit software to quantify the percentage of cells in each compartment, as shown in the graph (collated from three donors). Shown are the mean and standard deviation of percentages. Differences between percentages in each compartment were tested by multiple unpaired t‐tests, with corrections for multiple tests by the Holm‐Sidak method. **adjusted p < 0·01, *adjusted p < 0·05. (c) Reovirus mediated inhibition of IL‐15 induced NK cell proliferation. PBMC were labelled with CFSE, pre‐treated for 4 h with 1 MOI reovirus or cultured without virus. 10 ng/ml IL‐15 was then added and cells were cultured for a further 5 days. Cell division was assessed by CFSE loss using flow cytometry. Plots from a single donor are shown on the left with the percentage of cells that have proliferated after 5 days indicated. Data from four donors are shown on the right, analysed using a t‐test; **p < 0·01. NS = not significant
