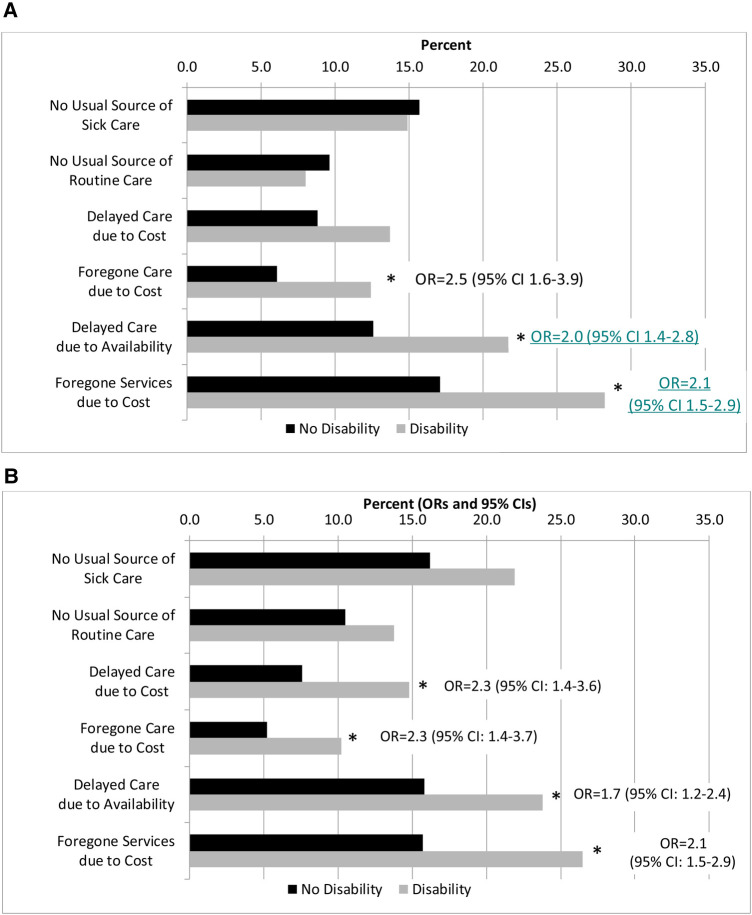
Figure 1.
Predicted probabilities of access to healthcare by race/ethnicity and disability Status. (A) Black, non-Hispanic Adults. (B) Hispanic Adults. *p < 0.017, Indicates that the Odds ratios (OR) and 95% confidence intervals (CI) from logistic regression controlling for age, sex, marital status, employment status, educational attainment, poverty ratio, chronic conditions, and health insurance type. The ORs represent the disability group in reference to the no disability group.

