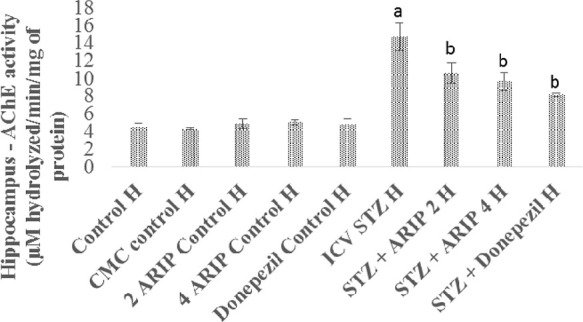
Figure 3.

Effect of various agents on brain hippocampus AChE activity. Results are expressed as mean ± standard deviation using one-way ANOVA followed by Tukey’s test; a denotes p < 0.001 vs control group; b denotes p < 0.001 vs STZ-treated group. Where H is hippocampus; control H—control; CMC control H—carboxymethylcellulose control; 2 ARIP control H—aripiprazole 2 mg/kg control; 4 ARIP control H—aripiprazole 4 mg/kg control; donepezil control H—donepezil 0.1 mg/kg control; ICV STZ H—streptozotocin control; STZ + ARIP 2 H—ICV STZ + aripiprazole 2 mg/kg; STZ + ARIP 4 H—ICV STZ + aripiprazole 4 mg/kg; and STZ + donepezil H—ICV STZ + donepezil 0.1 mg/kg.
