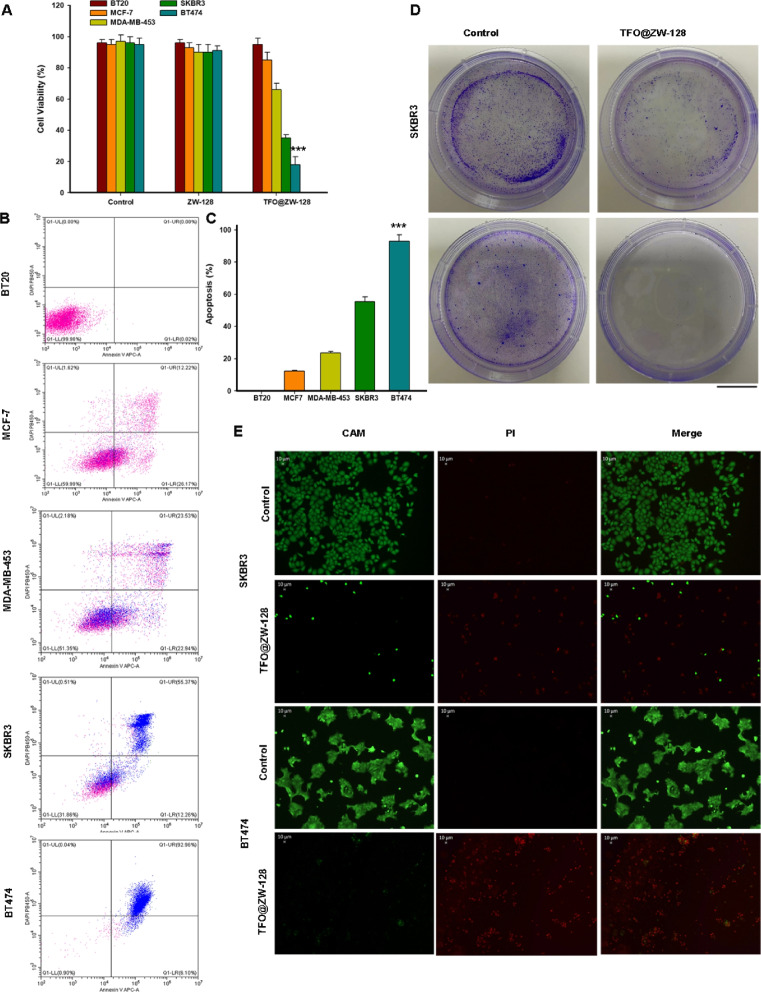
Fig. 4.
In vitro therapy of TFO@ZW-128. A. Cell viability was assessed using the CCK8 method after 72 h of treatment with TFO@ZW-128 in different breast cancer cells. Data are presented as mean ± SEM and were analyzed by paired Student’s t-test; Error bars represent SEM of the technical replicates (2 biological replicates with at least 2 technical replicates each). ***, P = 0.001; N = 3 independent experiments. B. Flow cytometry was used to analyze the cellular uptake of TFO@ZW-128 and its effect on apoptosis in different breast cancer cells. C. The bar chart demonstrates the ratio of apoptosis. Statistical significance was calculated by two-sided Student’s t test and the data are mean ± SEM (***, P = 0.008, BT474 compared with other cells). D. Clonogenic assays were performed after treating SKBR3 and BT474 cells with TFO@ZW-128. Scale bars: 10 mm. E. Live/dead staining of SKBR3 and BT474 cells treated with TFO@ZW-128. Scale bars: 10 μm

