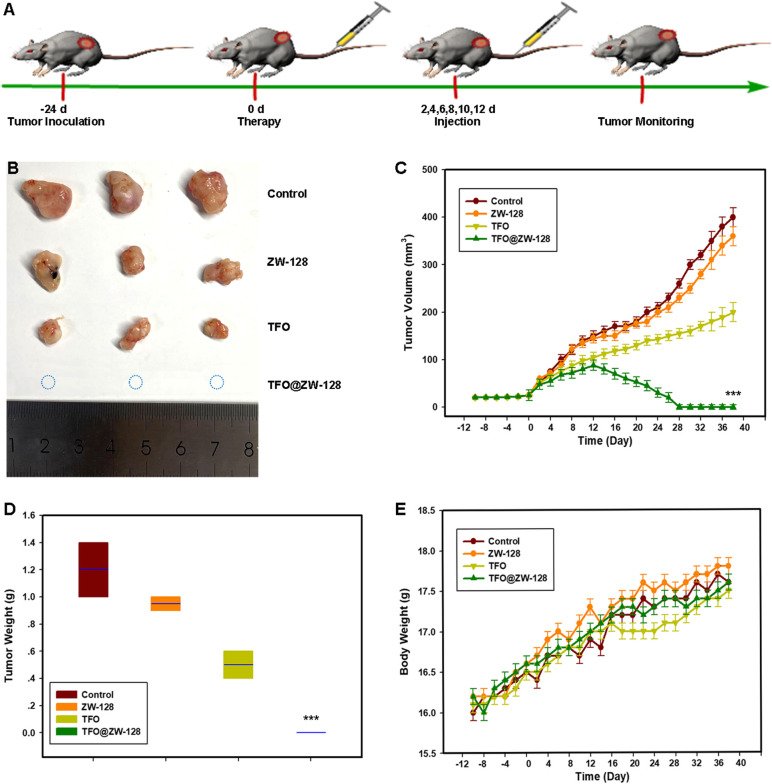
Fig. 6.
Antitumor effects of TFO@ZW-128 in the BT474 tumor model. A. Schematic illustration of establishing BT474 tumor-bearing mice model for anti-tumor effect. B. The tumor photo of the tumor. C. The tumor volume growth curves of tumors. Results were analyzed by Tukey's post hoc test and the data are mean ± SEM (***, P = 0.001, TFO@ZW-128-treated compared with others). Error bars represent SEM of the technical replicates (n = 3). D. The weight of the tumor. Results were analyzed by Tukey's post hoc test and the data are mean ± SEM (***, P = 0.001, TFO@ZW-128-treated compared with others). Error bars represent SEM of the technical replicates (n = 3). E. Body weight change curves in different groups. There was no statistical difference

