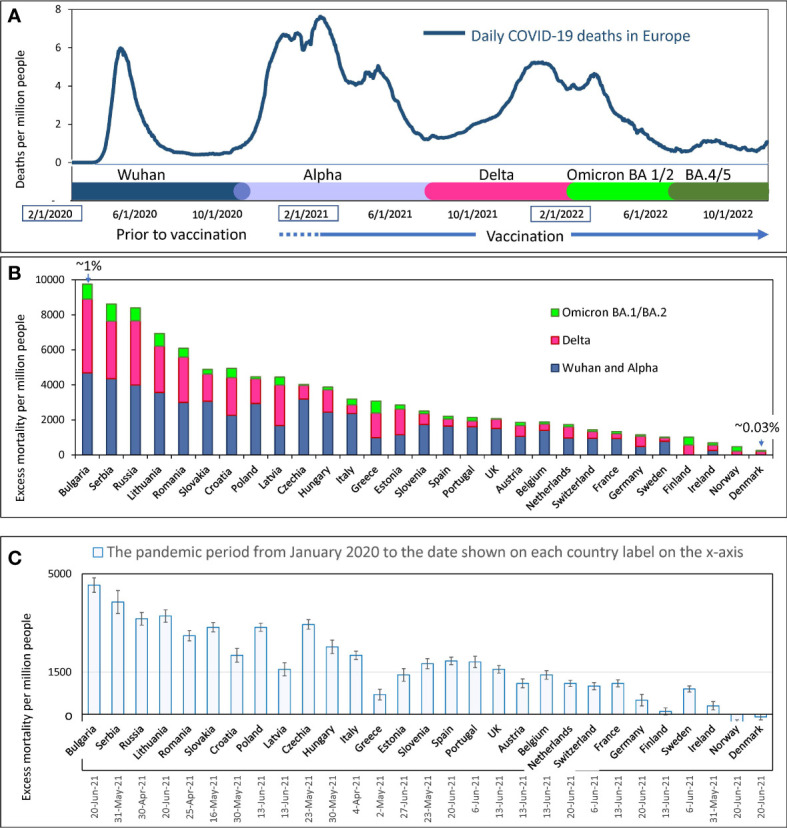
Figure 3.

Mortality during COVID-19 pandemics in Europe (A) Visualization of infection waves as weekly averaged confirmed COVID-19 deaths in Europe during the pandemic through October 15, 2022. Different time intervals are highlighted in distinct colors. Information on excess mortality and dominant virus variants in each time interval was taken from the OWID database. The information is shown in more detail in the Supplementary Figure 1 . (B) Excess mortality estimates for each European country for the COVID-19 pandemic period from February 2020 to May 2022. Estimates are from the OWID database and are derived from the Karlinsky-Kobak model. Each column represents three different time intervals, which are highlighted with the same colors as in “A”. (C) Karlinsky - Kobak model estimates of excess mortality values over the time from the beginning of the pandemic up to the summer of 2021 with the standard deviation intervals.
