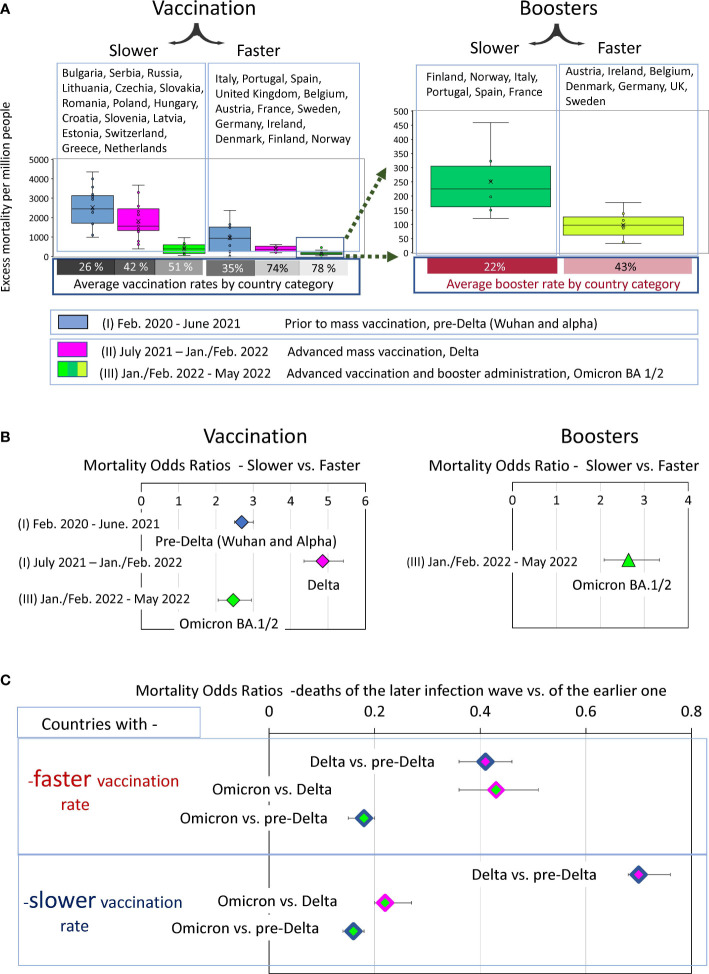
Figure 8.
Analysis of COVID-19 associated excess deaths averaged for country categories. (A) Distribution of excess mortality values in two categories of countries at three different time intervals of the pandemic, visualized as boxplots. (B) Odds ratio of dying in each time interval depending on the country category. (C) Odds ratio of dying in later infection waves versus the previous infection waves depending on the country category.

