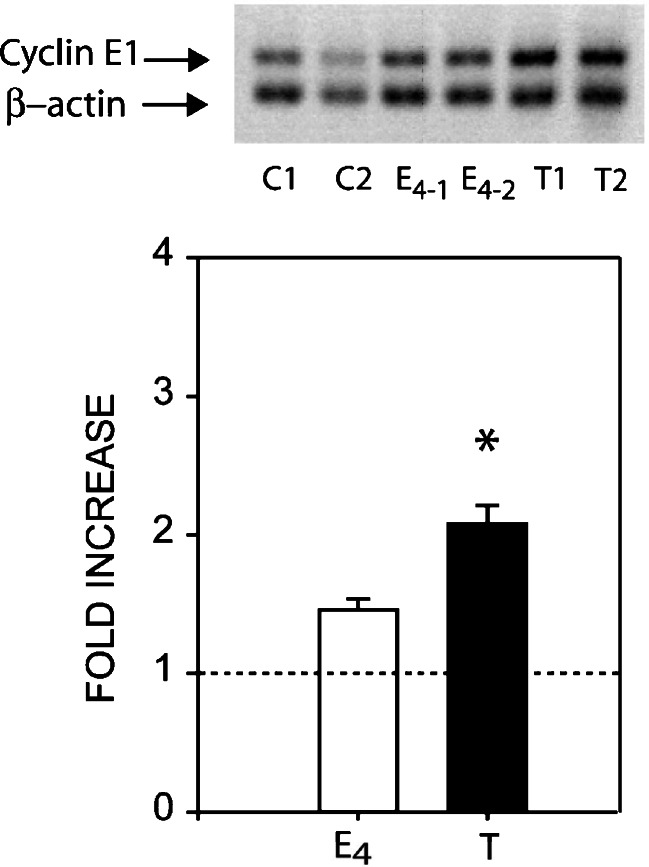
Fig. 6.
Expression of cyclin E1 mRNA by semiquantitative reverse transcriptase-polymerase chain reaction. Top: a representative membrane showing amplified cyclin E1 (196 bp) and β-actin (119 bp) cDNA transcripts subjected to 1–2% agarose gel electrophoresis in untreated mammary glands (C1-2), E2-treated mammary glands (E4 1-2), and E2-induced mammary tumors (MTs) (T1-2). Bottom: cyclin E1 expression increased 1.46-fold after 4.0-month E2-treatment and 2.08-fold in E2-induced MTs. Densitometric values for cyclin E1 were normalized against β-actin, and fold increases were represented as the mean ± standard error (n = 6). Statistical significance was determined by one-way analysis of variance with a Tukey post hoc test, *p < 0.05 vs control. The dotted line indicates the mean of control untreated age-matched samples.

