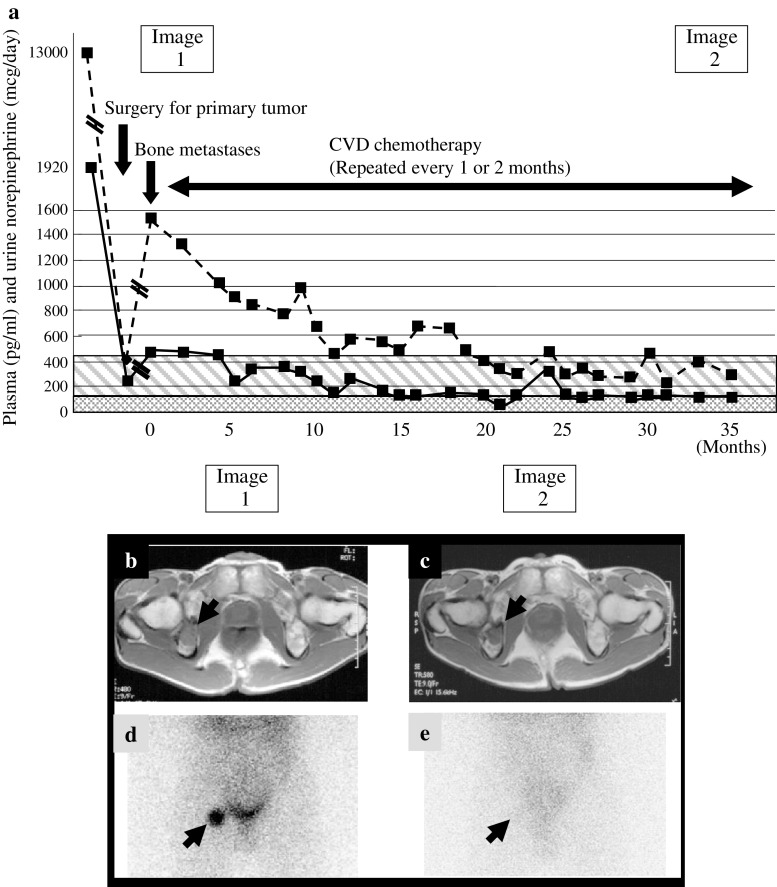
Fig. 2.
Clinical course (a) of a patient who showed dissociation between catecholamine levels and MRI findings (b, c). Despite biochemical responses there was no tumor response as measured by MRI. While the findings on 123-I-MIBG (d, e) did correlate with the decline in catecholamine levels during treatment with CVD. The solid line shows urine norepinephrine (in microgram per day) and the dotted line shows plasma norepinephrine (in picogram per milliliter)

