
Fig. 1.
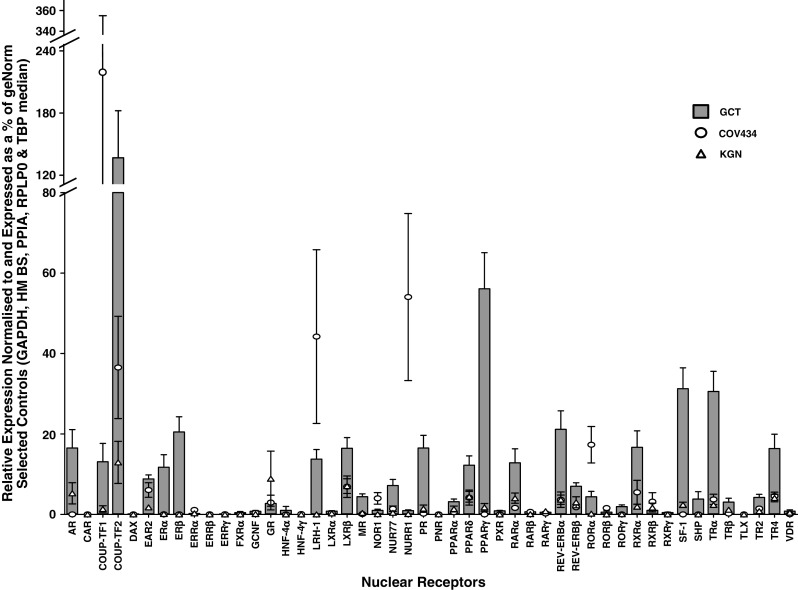
Nuclear receptor gene expression analysis in Granulosa cell tumors of the ovary (GCT) and GCT-derived cell lines, COV434 and KGN. Values were averaged over 14 GCT samples and over three replicate experiments for the COV434 and KGN cell lines. Samples with a CT value of ≥35 were given a value of 0. Data are presented as the relative expression normalized to and expressed as a percentage of the median of the geNorm-selected controls of GAPDH, HMBS, RPLPO, and TBP. The bar graphs represent mean ± SEM for the GCT; the values for the COV434 and KGN cells are the mean of three independent determinations. Actual values are shown in the Electronic Supplementary Material (Online Resource 1)