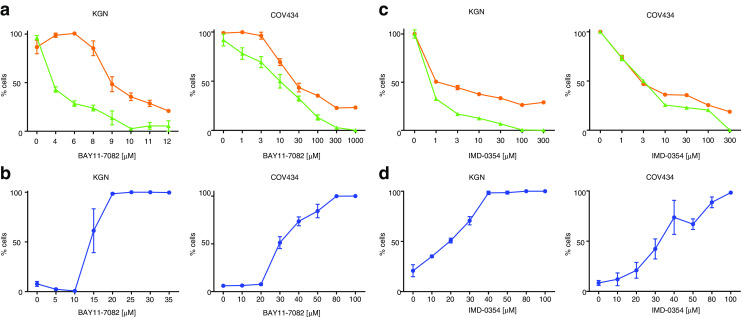
Fig. 3.

Effects of IκBα-specific inhibitors on KGN and COV434 cell viability, cell proliferation, and apoptosis. Subconfluent KGN and COV434 cells were treated with incremental concentrations of BAY11-7082 (a, b) or IMD-0354 (c, d) for 24 h. Cell proliferation was examined by quantifying the formazan product of MTS reduction after 24 h (orange circle). Cell viability was examined by measuring ATP present after 24 h (green triangle). Each point represents the mean ± SEM of four separate experiments performed in triplicate, relative to the baseline activity detected in those cells treated with vehicle alone. To assess apoptosis, 30 min prior to the end of treatment, cells were stained with the nuclear dyes, Hoechst 33342 and Yo-Pro-1. Live cell fluorescent microscopy imaging was performed, exciting cells at 340 ± 50 nm (for Hoechst 33342) and 455 ± 40 nm (Yo-Pro®-1) and measuring fluorescence emission at 515 ± 20 nm (for both). Cell mortality was quantified by expressing the number of Yo-Pro®-1-positive cells as a percentage of the number of Hoechst 33342-positive cells (blue circle). Each point represents the mean ± SEM of triplicate measurements within one representative assay performed in triplicate
