Fig. 3.
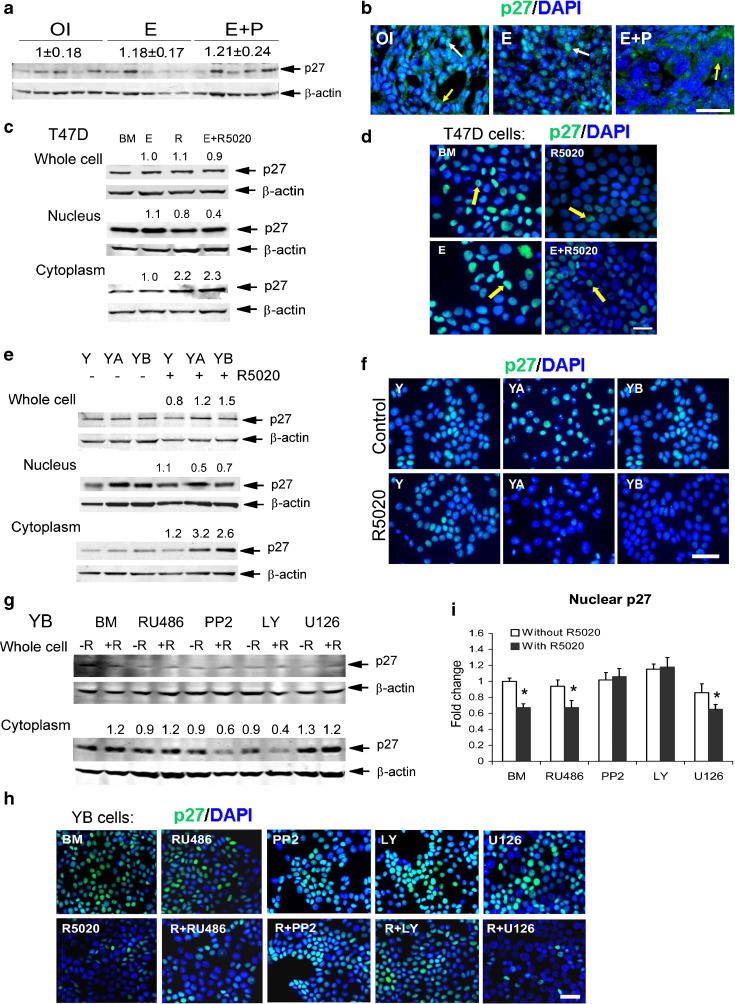
Combined treatment with estrogen and progesterone causes cytoplasmic localization of p27 in rat mammary tumors in vivo and T47D cells in vitro. a, b Tumors were from carcinogen-treated ovary-intact (OI) or ovariectomized rats treated with estradiol alone (E) or estradiol plus progesterone (E + P). a Immunoblot of p27 in tumor whole cell extracts (N = 5 tumors/group). Numbers above p27 bands indicate mean ± SEM levels of p27 compared with OI tumors. b Representative images of p27 immunostaining in tumors. Cytoplasmic p27 (green, white arrows), nuclear p27 (teal, yellow arrows), and nuclei (blue). Scale bar 100 μm. c–f T47D cells co-expressing PRA and PRB were treated with estradiol (E), R5020 (R), or E + R for 24 h. Y, YA, and YB cells were treated with or without R5020 for 24 h. Representative images of nuclear p27 staining (teal, yellow arrows). c, e Immunoblot of p27 in whole cell, nuclear, and cytoplasmic extracts. Numbers above bands indicate p27 levels in treated cells compared to basal media control (BM). d, f Representative images of p27 immunostaining in T47D cells (d) or Y, YA, and YB cells (f). h, i YB cells were treated with or without R5020 and with or without PR inhibitor RU486, PI3 kinase inhibitor LY294002 (LY), Src inhibitor PP2, and MEKK1/2 inhibitor (U126). g Immunoblot of p27 in whole cell and cytoplasmic extracts. The levels of p27 in whole cell extract were not changed by any treatment. Numbers above bands indicate p27 levels in the cytosol of treated cells compared to basal media control (BM). h Representative images of cells stained with anti-p27 antibody (teal) and i quantitative analysis of nuclear p27 staining in treated cell relative to BM. * P < 0.05 compared to BM. b, d, f, h Nuclei are stained with DAPI (blue). Scale bars 50 μm

