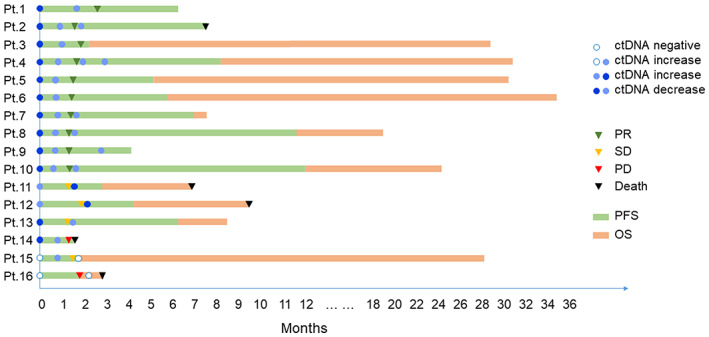
FIGURE 3.

ctDNA changes during treatment. Event chart showing timing of therapy, clinical responses, outcomes, and results of ctDNA testing for each patient. ctDNA, circulating tumor DNA. PR, partial response. SD, stable disease. PD, progression disease. PFS, progression‐free survival. OS, overall survival.
