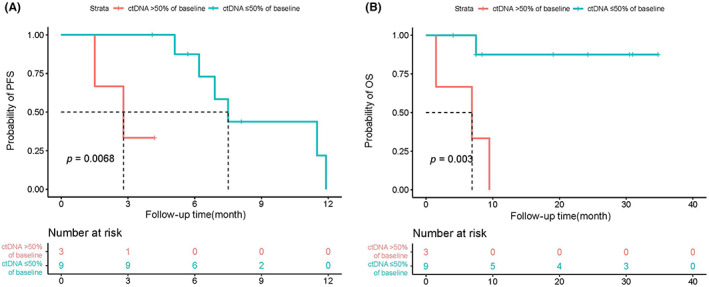
FIGURE 5.

The changes in ctDNA levels over a 50% reduction from baseline are strongly correlated with PFS and OS. Kaplan–Meier curves for PFS (A) or OS (B) dichotomized using a 50% decrease in ctDNA burden relative to baseline. ctDNA, circulating tumor DNA; OS, overall survival; PFS, progression‐free survival.
