
FIGURE 2.
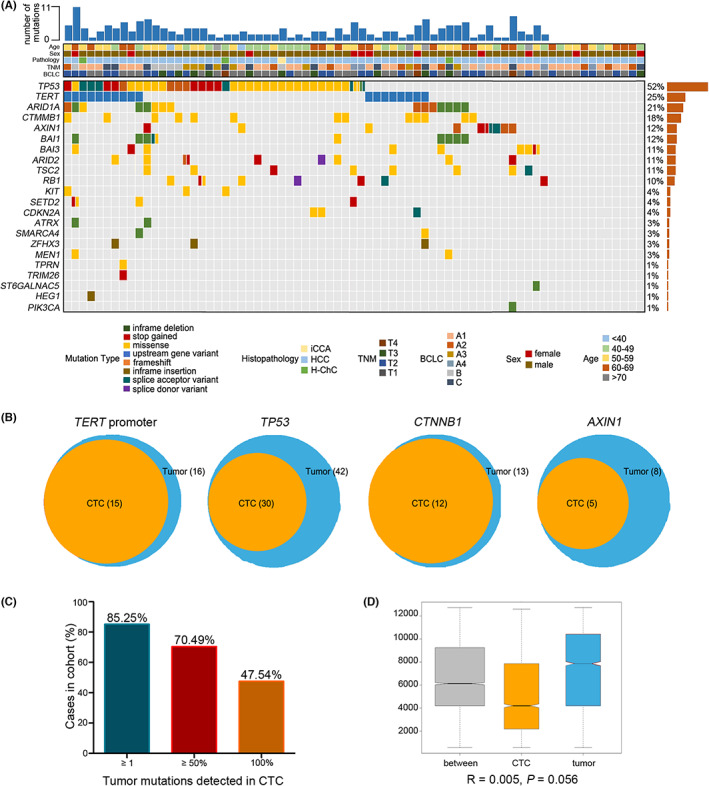
Consistency of mutations between primary tumor tissues and circulating tumor cells (CTCs). (A) Targeted sequencing of 16 driver genes was conducted in 73 HCC primary tumor tissues. (B) Venn diagrams manifesting the consistency of the TERT promoter, TP53, CTNNB1, and AXIN1 mutations between tissues and CTCs. (C) The majority of cases show a high level of consistency among the driver gene variants detected in tumor tissues and corresponding CTCs in the same individuals. (D) The mutation consistency between the tumor tissues and CTCs is shown through analysis of similarities (ANOSIM), which was calculated based on the Euclidean distance matrix.