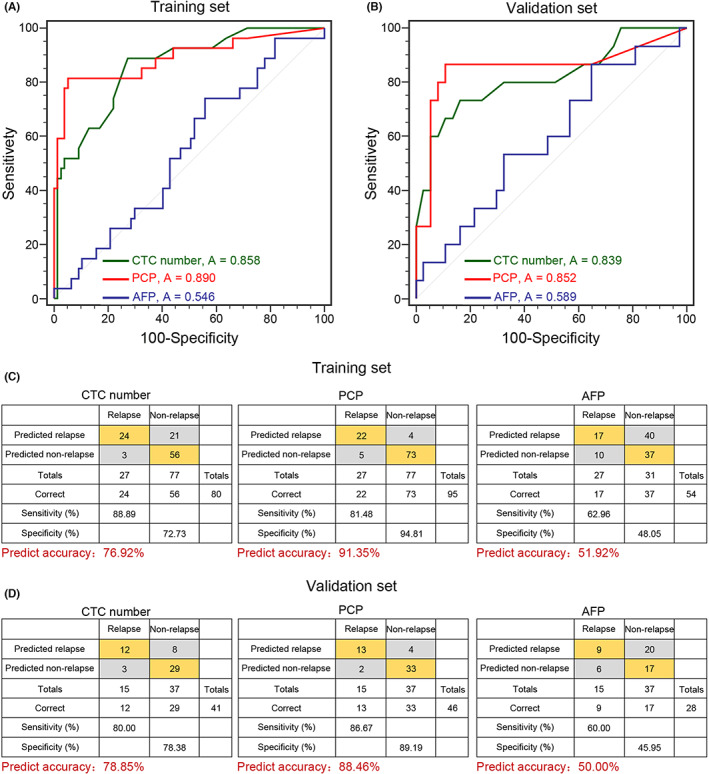
FIGURE 4.

Performance of the CTC number and PCP in the training and validation data sets. (A) and (B) The capabilities of the CTC number, PCP and AFP level in predicting HCC recurrence were estimated with ROC curves in the training data set and validation data set. (C) and (D) Confusion tables of the binary results of the CTC number, proliferative CTCs, and AFP level in the training and validation data sets. A, area under the curve; AFP, alpha‐fetoprotein; CTC, circulating tumor cell; PCP, proliferative CTC percentage.
