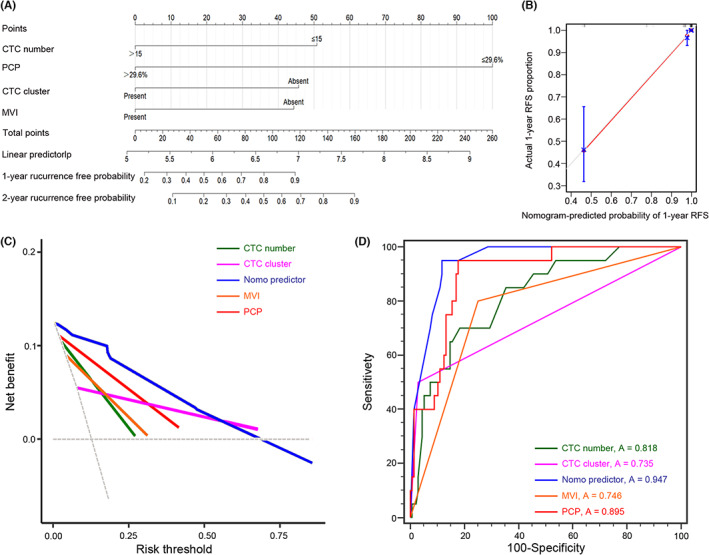
FIGURE 6.

Establishment of recurrence‐free survival nomograms. (A) A nomogram predicting the risk of recurrence in patients with HCC. The value of each of variable was given a score on the point scale axis. A total score could be easily calculated by adding each single score, and by projecting the total score to the lower total point scale, the probability of recurrence was estimated. (B) The 1‐year calibration curves for the nomogram. The x‐axis represents the nomogram‐predicted probability, and the y‐axis represents the actual probability of 1‐year recurrence. (C) Decision curve analysis of the nomogram predictor, CTC number, PCP, CTC clusters, and MVI. (D) The capabilities of the nomogram predictor, CTC number, PCP, CTC clusters, and MVI in predicting HCC recurrence were estimated with ROC curves in the total data set. A, area under the curve; CTC, circulating tumor cell; MVI, microvascular invasion; PCP, proliferative CTC percentage; RFS, recurrence‐free survival.
