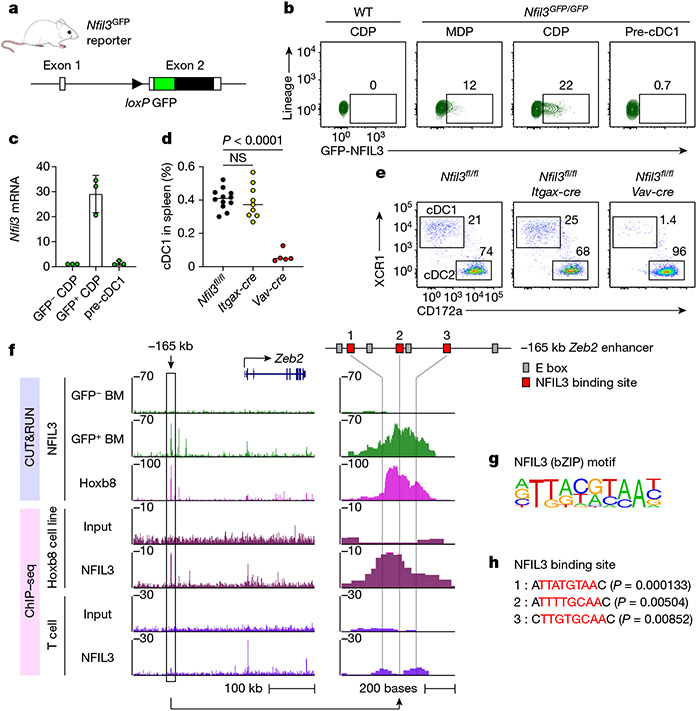
Fig. 1 ∣. Transient NFIL3 expression drives cDC1 specification.
a, Schematic of the Nfil3GFP reporter mice. Filled and open boxes denote coding and noncoding exons of Nfil3, respectively. b, Representative flow cytometry plots showing GFP–NFIL3 expression in MDPs, CDPs and pre-cDC1 progenitors from the BM of Nfil3GFP/GFP mice. The percentage of each cell type expressing GFP–NFIL3 is shown. c, Nfil3 transcripts normalized to Gapdh, measured by quantitative PCR with reverse transcription (RT–qPCR), in GFP–NFIL3− CDP, GFP–NFIL3+ CDP and pre-cDC1 from Nfil3GFP/GFP mice. Data are pooled from three independent experiments (n = 3 for each cell type). d, Frequency of splenic cDC1 in Nfil3fl/fl, Nfil3fl/fl Itgax-cre and Nfil3fl/fl Vav-cre mice. Data are pooled from five independent experiments (n = 12 for Nfil3fl/fl, 9 for Nfil3fl/fl Itgax-cre and 5 for Nfil3fl/fl Vav-cre mice). Nfil3fl/fl versus Nfil3fl/fl Itgax-cre, P = 0.9067. e, Representative flow cytometry plots showing splenic cDC1s and cDC2s in Nfil3fl/fl, Nfil3fl/fl Itgax-cre and Nfil3fl/fl Vav-cre mice. Percentages of each cell type are indicated. f, CUT&RUN and ChIP–seq tracks display NFIL3 binding around the Zeb2 locus in GFP–NFIL3− BM cells, GFP–NFIL3+ BM cells, the NFIL3-expressing Hoxb8 cell line or T cells, visualized with the UCSC genome browser. g, Homer NFIL3 motif. h, FIMO analysis depicting P-values of the three NFIL3 binding sites in the −165 kb Zeb2 enhancer. The Homer NFIL3 motif (shown in g) is used in FIMO analysis. Red residues indicate core NFIL3 motif. Data in c are mean±s.d. Centre values in d indicate median. NS, not significant. Brown–Forsythe and Welch ANOVA with Dunnett’s T3 multiple comparisons test is used in d.

