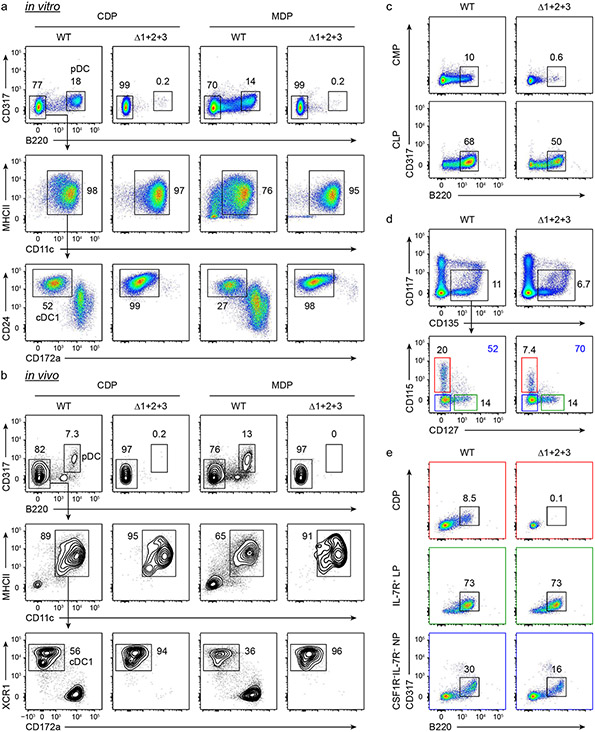
Extended Data Figure 8. Myeloid and lymphoid pathways of pDC development are distinguished by different requirements in the −165 kb Zeb2 enhancer.
a, Representative flow plots showing pDCs and cDCs differentiated from sort purified CDPs and MDPs of WT and Δ1+2+3 mice, assessed after 5 days of culture with Flt3L. Data shown are one of three similar experiments. b, Representative flow plots showing in vivo developmental potential of CDPs and MDPs from WT and Δ1+2+3 mice. CDPs and MDPs (8 × 10³ - 8 × 10⁴) were sort purified and i.v. injected into sub-lethally irradiated CD45.1 recipients (B6-Ly5.1/Cr mice). After 7 days, recipient spleens were analyzed for the presence of CD45.2+ donor-derived pDCs and cDCs (pre-gate: CD45.2+ CD45.1− cells). Data shown are one of two (CDP) or three (MDP) similar experiments. c, Representative flow plots showing pDCs differentiated from sort purified CMPs and CLPs of WT and Δ1+2+3 mice, assessed after 7 (CMPs) or 5 (CLPs) days of culture with Flt3L. Data shown are one of two (CMP) or three (CLP) similar experiments. d, Representative flow plots showing CDPs (CD115+ CD127−), IL-7R+ LPs (CD115− CD127+) and IL-7R− CSF1R− NPs (CD115− CD127−) in the BM of WT and Δ1+2+3 mice (pre-gate: lineage− CD16/CD32− CD135+ CD117int-neg cells). Data shown are one of three similar experiments. e, Representative flow plots showing pDCs differentiated from sort purified CDPs, IL-7R+ LPs and IL-7R−CSF1R− NPs (as in d) of WT and Δ1+2+3 mice, assessed after 4 days of culture with Flt3L. Data shown are one of three similar experiments.

