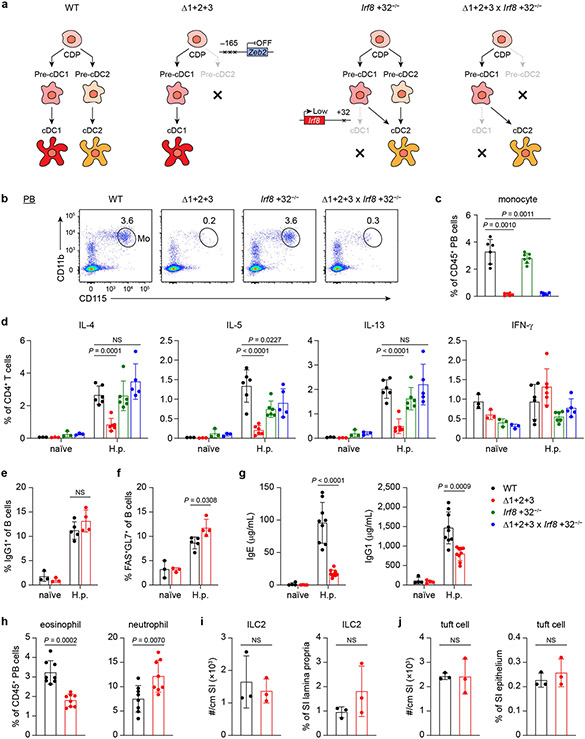
Extended Data Fig. 10 ∣. Zeb2 is not required for the maintenance of cDC2, which support TH2 responses to H. polygyrus infection.
a, Diagrams showing DC development in WT, Δ1+2+3, Irf8 +32−/− and Δ1+2+3 × Irf8 +32−/− mice. b, Representative flow plots showing monocytes among CD45+ peripheral blood cells from WT, Δ1+2+3, Irf8 +32−/− and Δ1+2+3 × Irf8 +32−/− mice. c, Frequency of peripheral blood monocytes in WT, Δ1+2+3, Irf8 +32−/− and Δ1+2+3 × Irf8 +32−/− mice. Data are pooled from two independent experiments (n = 6 for WT, Δ1+2+3, n = 7 for Irf8 +32−/− and n = 6 for Δ1+2+3 × Irf8 +32−/− mice). d, Frequency of IL-4, IL-5, IL-13 or IFN-γ expressing CD4+ T cells in MLNs from WT, Δ1+2+3, Irf8 +32−/− and Δ1+2+3 × Irf8 +32−/− naïve mice or mice infected with H.p. for 14 days (pre-gate: TCRβ+CD4+ cells). Data are pooled from two independent experiments (n = 3 for naïve mice, n = 6 for H.p. infected WT, Δ1+2+3, Irf8 +32−/− mice and n = 5 for H.p. infected Δ1+2+3 × Irf8 +32−/− mice). WT versus Δ1+2+3 × Irf8 +32−/− IL-4 expressing CD4+ T cells in H.p. infected mice P = 0.1044, WT versus Δ1+2+3 × Irf8 +32−/− IL-13 expressing CD4+ T cells in H.p. infected mice P = 0.8243. e, f, Frequency of IgG1+ class-switched B cells (e) or FAS+GL7+ germinal center B cells (f) of total CD19+ B cells in MLNs from WT or Δ1+2+3 naïve mice or mice infected with H.p. for 14 days (n = 3 for WT or Δ1+2+3 naïve mice, n = 5 for H.p. infected WT mice and n = 4 for H.p. infected Δ1+2+3 mice). WT versus Δ1+2+3 IgG1+ class-switched B cells in H.p. infected mice P = 0.2145. g, Total serum IgE and IgG1 in naïve WT, Δ1+2+3 mice or mice infected with H.p. for 14 days. Data are pooled from two independent experiments (n = 4 for naïve mice and n = 9 for H.p. infected mice). h, Frequency of peripheral blood eosinophils and neutrophils in WT and Δ1+2+3 mice (n = 8 for each genotype). i, Number of ILC2s per cm small intestine and frequency of ILC2s in small intestine lamina propria CD45+ cells of WT and Δ1+2+3 mice (n = 3 for each genotype). WT versus Δ1+2+3 ILC2 number P > 0.9999, frequency P = 0.4000. j, Number of tuft cells per cm small intestine and frequency of tuft cells in small intestine epithelium CD45− cells of WT and Δ1+2+3 mice (n = 3 for each genotype). WT versus Δ1+2+3 tuft cell number P = 0.7000, frequency P = 0.7000. Mean ± s.d.; NS, not significant; c: Brown–Forsythe and Welch ANOVA with Dunnett’s T3 multiple comparisons test; d: ordinary two-way ANOVA with Dunnett’s multiple comparisons test; e–g: unpaired, multiple t tests with Welch correction; h–j: unpaired, two-tailed Mann–Whitney test.

