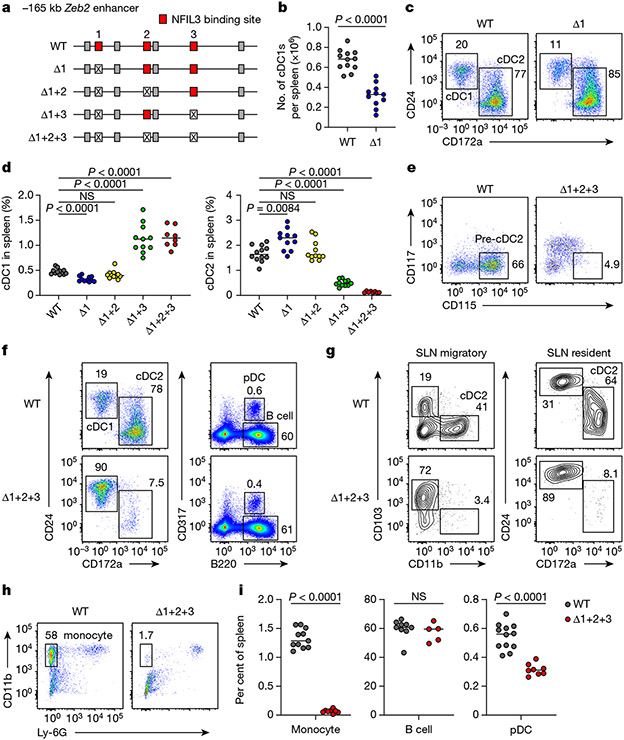
Fig. 2 ∣. Mutation of three NFIL3 binding sites in the −165 kb Zeb2 enhancer abrogates cDC2 and monocyte development.
a, Schematic of WT, Δ1, Δ1+2, Δ1+3 and Δ1+2+3 mice. Red, crossed and grey boxes denote NFIL3 binding sites, mutated NFIL3 binding sites and E-box motifs, respectively. b, The number of splenic cDC1 in WT and Δ1 mice. Data are pooled from five independent experiments (n = 12 for WT and 11 for Δ1 mice). c, Representative flow cytometry plots showing splenic cDC1s and cDC2s in WT and Δ1 mice. The percentage of each cell type is indicated. d, Frequency of splenic cDC1 and cDC2 in WT, Δ1, Δ1+2, Δ1+3 and Δ1+2+3 mice. Data are pooled from five independent experiments (n = 12 for WT, 11 for Δ1, Δ1+2 and Δ1+3, and 8 for Δ1+2+3 mice). WT versus Δ1+2 cDC1, P= 0.2003, WT versus Δ1+2 cDC2, P = 0.9348. e, Representative flow cytometry plots showing BM pre-cDC2s in WT and Δ1+2+3 mice. Data shown are from one of five similar experiments. f, Representative flow cytometry plots showing splenic cDCs, pDCs and B cells in WT and Δ1+2+3 mice. g, Representative flow cytometry plots showing migratory and resident cDC2s in inguinal skin-draining lymph nodes (SLNs) from WT and Δ1+2+3 mice. Data shown are from one of three similar experiments. h, Representative flow cytometry plots showing splenic monocytes in WT and Δ1+2+3 mice. i, Frequency of splenic monocytes, B cells and pDCs in WT and Δ1+2+3 mice. Data are pooled from five independent experiments for monocytes and pDCs, and three for B cells (monocytes: n = 11 for WT, 8 for Δ1+2+3 mice; B cells: n = 9 for WT, 5 for Δ1+2+3 mice; pDCs: n = 12 for WT, 8 for Δ1+2+3 mice). WT versus Δ1+2+3 B cell, P = 0.4376. Centre values in scatter plots indicate median. b,i, Unpaired, two-tailed Mann–Whitney test. d, Brown–Forsythe and Welch ANOVA with Dunnett’s T3 multiple comparisons test.

