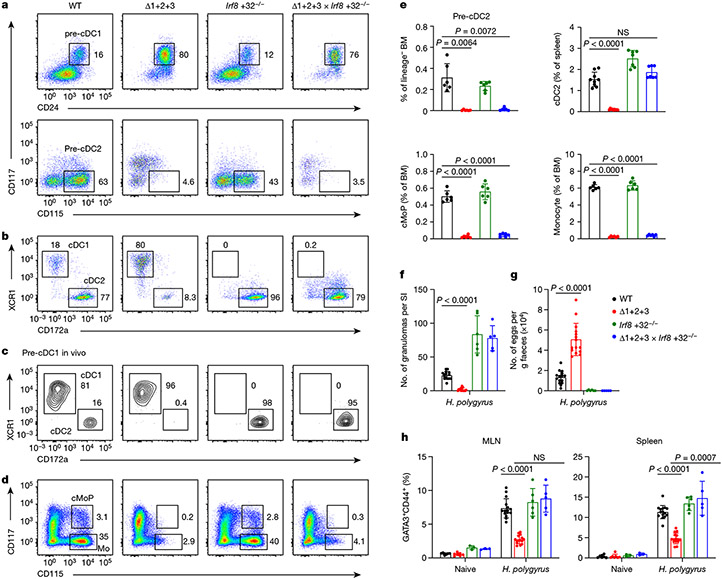
Fig. 4 ∣. Zeb2 is only required for the specification of cDC2, which support TH2 responses to H. polygyrus infection.
a, Representative flow cytometry plots showing BM pre-cDC1s and pre-cDC2s in WT, Δ1+2+3, Irf8 +32−/− and Δ1+2+3 × Irf8 +32−/− mice. b, Representative flow cytometry plots showing splenic cDC1s and cDC2s from the indicated mice. c, Representative flow cytometry plots showing in vivo developmental potential of pre-cDC1s from the indicated mice. Recipient spleens were analysed for CD45.2+ donor-derived cDCs. Data shown are from one of three similar experiments. d, Representative flow cytometry plots showing BM cMoPs and monocytes (Mo) from the indicated mice. e, Frequency of BM pre-cDC2s, splenic cDC2s, BM cMoPs and BM monocytes in the indicated mice. Data are pooled from four independent experiments (splenic cDC2: n = 9 for WT, Δ1+2+3, 7 for Irf8 +32−/−, Δ1+2+3 × Irf8 +32−/− mice; BM pre-cDC2, cMoP and monocyte: n = 6 for each genotype). WT versus Δ1+2+3 × Irf8 +32−/− splenic cDC2, P = 0.1408. f–h, Number of granulomas in small intestine (SI) (f) or faecal eggs (g), and frequency of TH2 cells in MLN and spleen (h) from the indicated naive mice or mice infected with H. polygyrus for 14 days. Data are pooled from four independent experiments (n = 7 for WT, Δ1+2+3, 3 for Irf8 +32−/−, Δ1+2+3 × Irf8 +32−/− naive mice; n = 15 for H. polygyrus-infected WT, Δ1+2+3, 6 for Irf8 +32−/−, 5 for Δ1+2+3 × Irf8 +32−/− mice). Frequency of WT versus Δ1+2+3 × Irf8 +32−/− TH2 cells in MLN of H. polygyrus-infected mice, P = 0.0577. Data are mean ± s.d. e–g, Brown–Forsythe and Welch ANOVA with Dunnett’s T3 multiple comparisons test. h, Ordinary two-way ANOVA with Dunnett’s multiple comparisons test.

