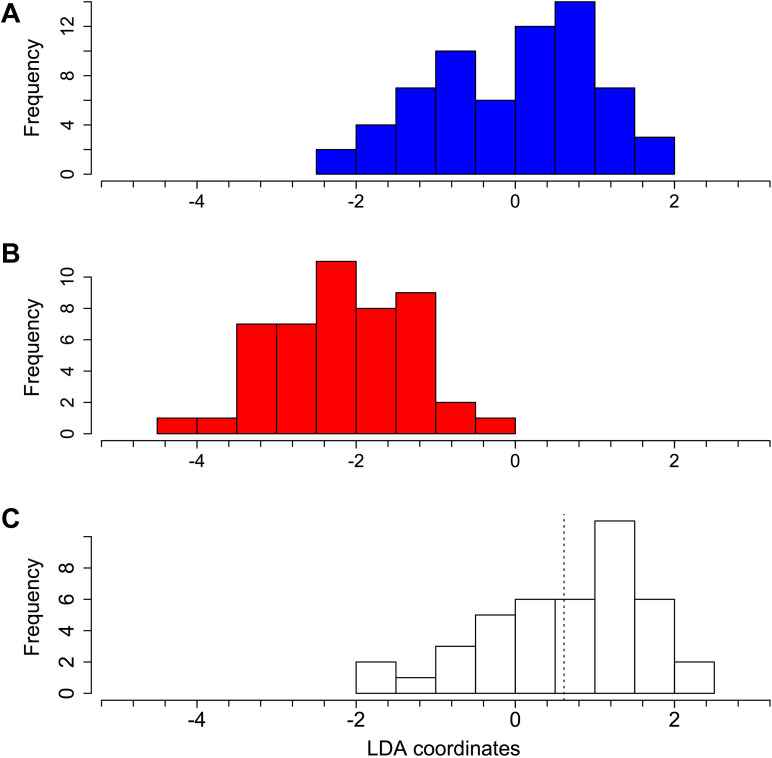
Figure 3.
Distribution of scaled LDA coordinates of each face on the male–female axis for heterosexual men (A), women (B), and homosexual men (C). The LDA coordinates are centered on the mean for heterosexual men. The vertical dotted line indicates the mean value for homosexual men. LDA = linear discriminant-function analysis.

