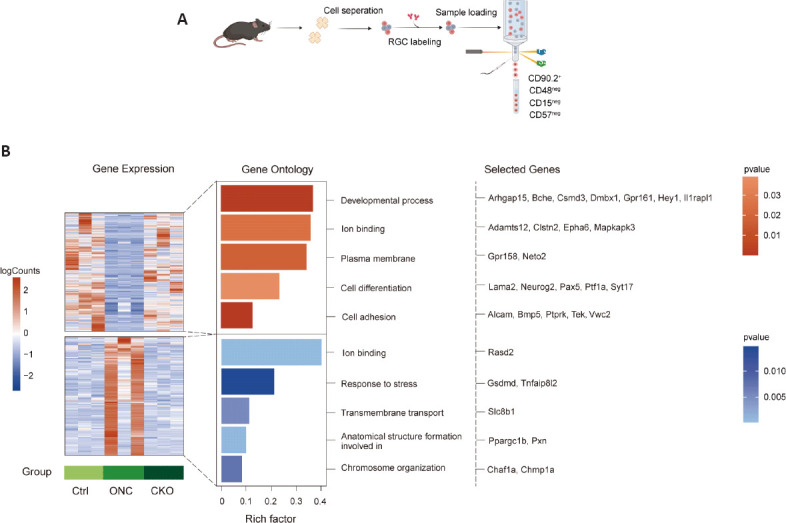
Figure 7.

RNA-sequencing for RGCs sorted by FACS.
(A) Schematic diagram of the experimental flow. RGCs were sorted by FACS at 0 (no crush) and 3 days following optic nerve crush (n = 8 retinas in each group), and RNA sequencing was performed. (B) mRNA expression in the three groups. Colors in the heatmap indicate the mRNA expression levels. Bar plot colors represent P-values of the top Gene Ontology terms associated with genes in each cluster. Representative genes for each term are shown. CKO: Conditional knockout; Ctrl: control; FACS: fluorescence-activated cell sorting; ONC: optic nerve crush; RGC: retinal ganglion cell; VGAT: vesicular γ-aminobutyric acid transporter.
