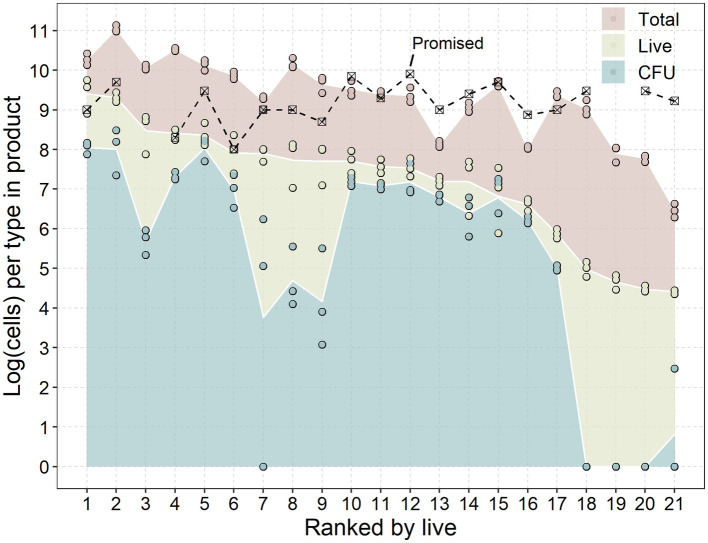
Figure 1.
Promised dose, colony forming units (CFU), live-and total cells of each product. Products were ranked on the x-axis in descending order from the average of live or viable-but-not-culturable (VBNC) probiotics according to Table 1. Data are presented as the base ten logarithm of the number of cells recovered from the products (Table 1) and analysed through a dilutions series plated on MRS agar (CFU), viability qPCR (live) and regular qPCR (total) from replicates on separate days (n = 3). Promised doses are presented as the per unit CFU dose.

