
Figure 1.
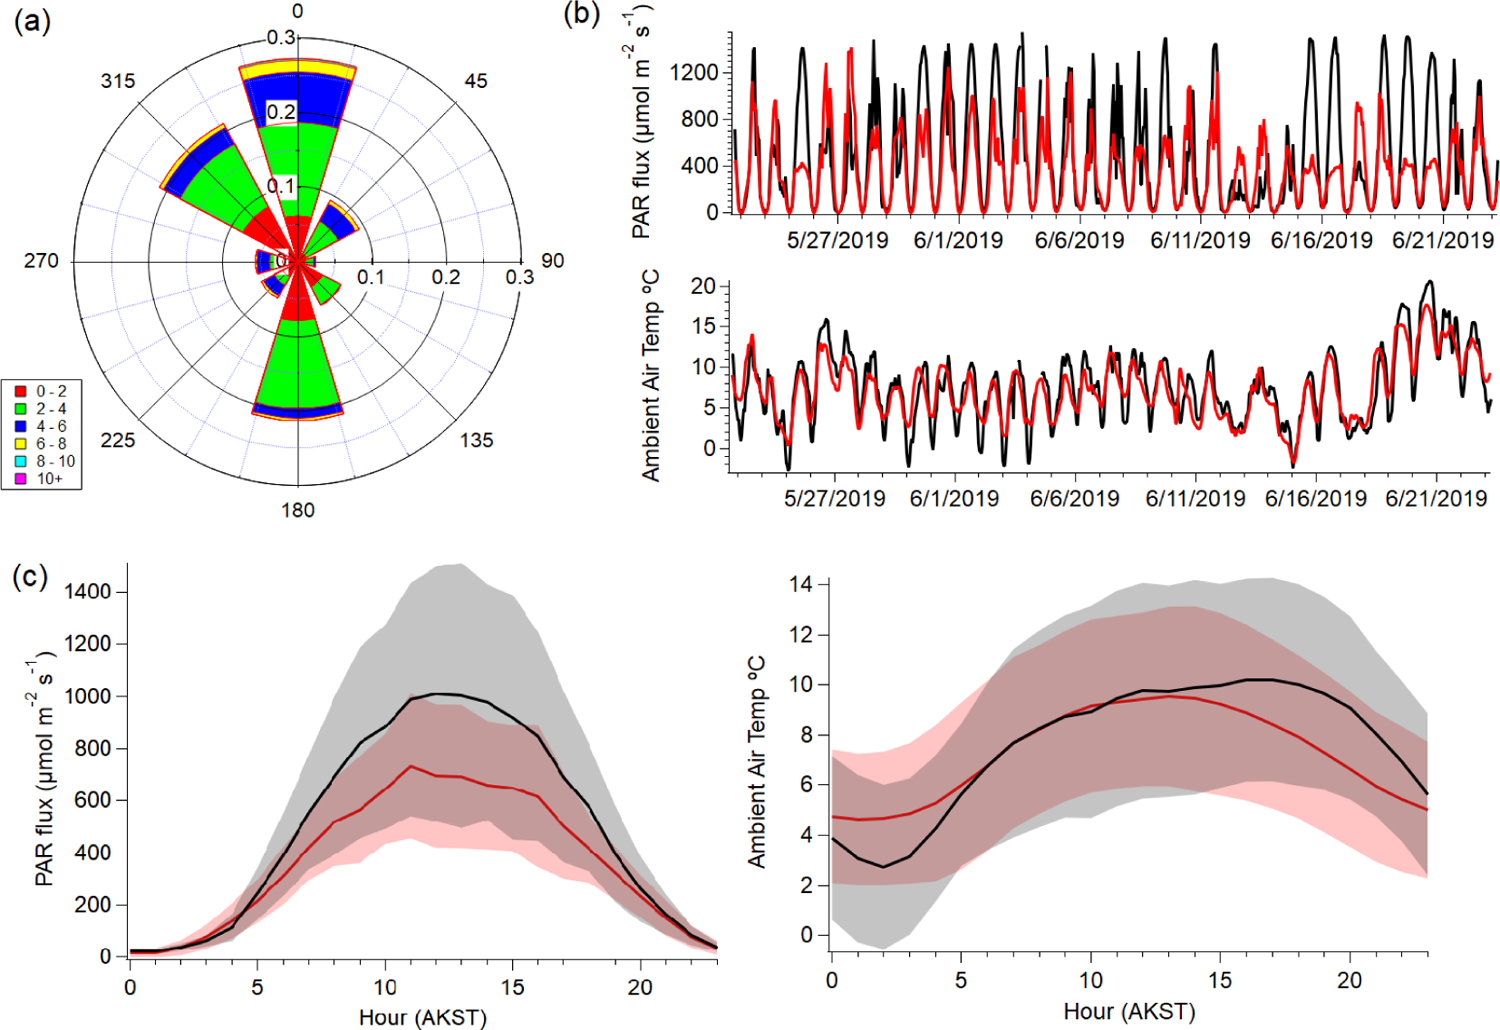
Meteorological data taken from TFS between 22 May to 23 June: (a) probability (0–1) wind rose plot depicting wind direction and speed; (b) temporal traces of observed (black) and simulated (red) hourly photosynthetically active radiation (PAR) and surface air temperature (°C); (c, d) diel plots of observed (black) and simulated (red) PAR and temperature. Shaded areas represent 1 standard deviation (1σ).