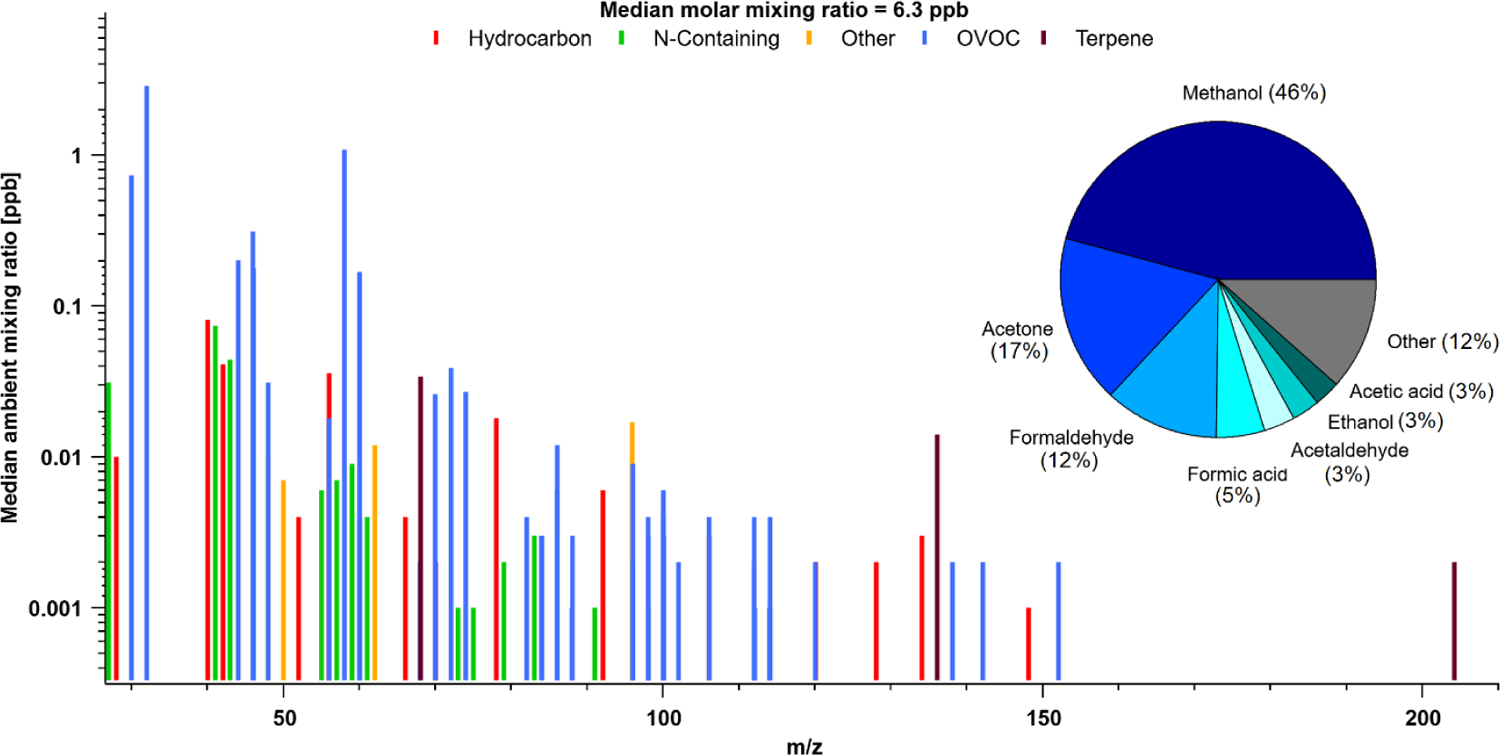
Figure 7.

Mass spectra of PTR-ToF-MS signal ions detected and corresponding median molar mixing ratios based on hourly data collected during the campaign. Pie chart shown is the contribution from most abundant species to total (molar) VOC mass (tVOC). Ions were grouped into subcategories based on their structure and functional group. See Table S1 for subcategory assignments.
