
Figure 9.
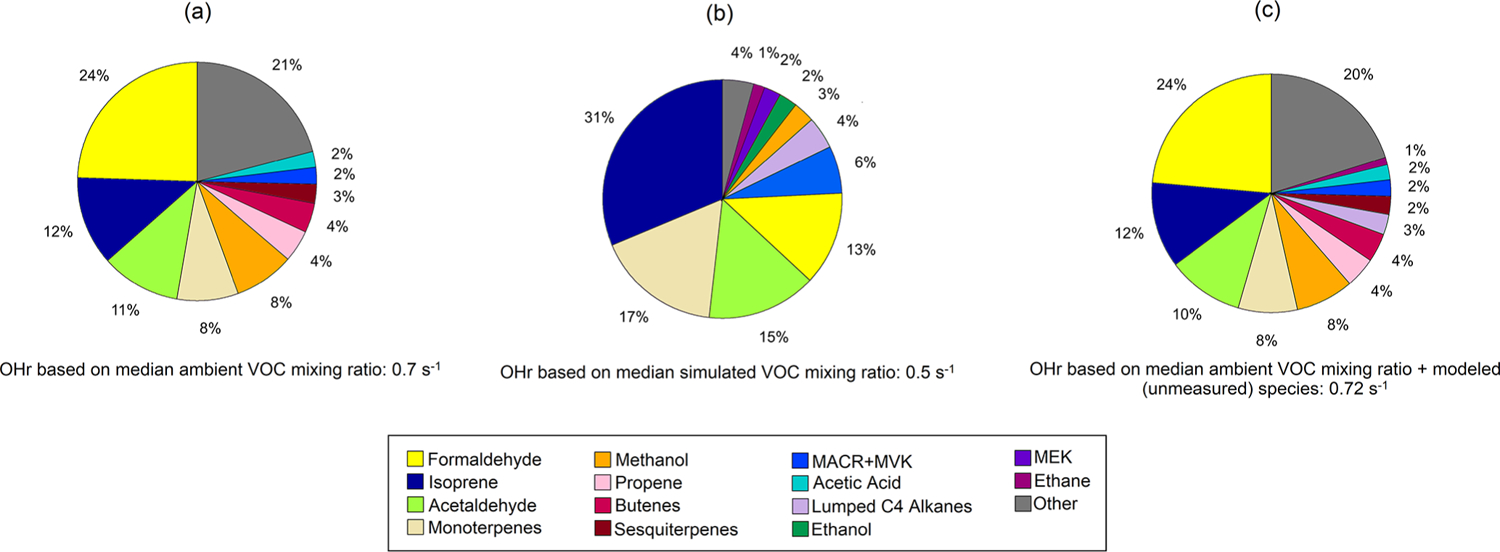
Pie charts of calculated OH reactivity (OHr) for observed (a) and simulated (b) species at Toolik Field Station (TFS). Also shown is our best guess of OHr at TFS with ethane and the other higher alkanes (Lumped C4 alkanes) estimated by the model (c). Relative contribution of individual compounds is calculated using median campaign mixing ratios and OH rate constant for that species. Rate constants for individual VOCs are compiled from previous literature, and rate constants of the dominant species or isomer at the detected PTR-ToF mass are used (Koss et al., 2018; Atkinson et al., 2004, 2006; Atkinson and Arey, 2003).