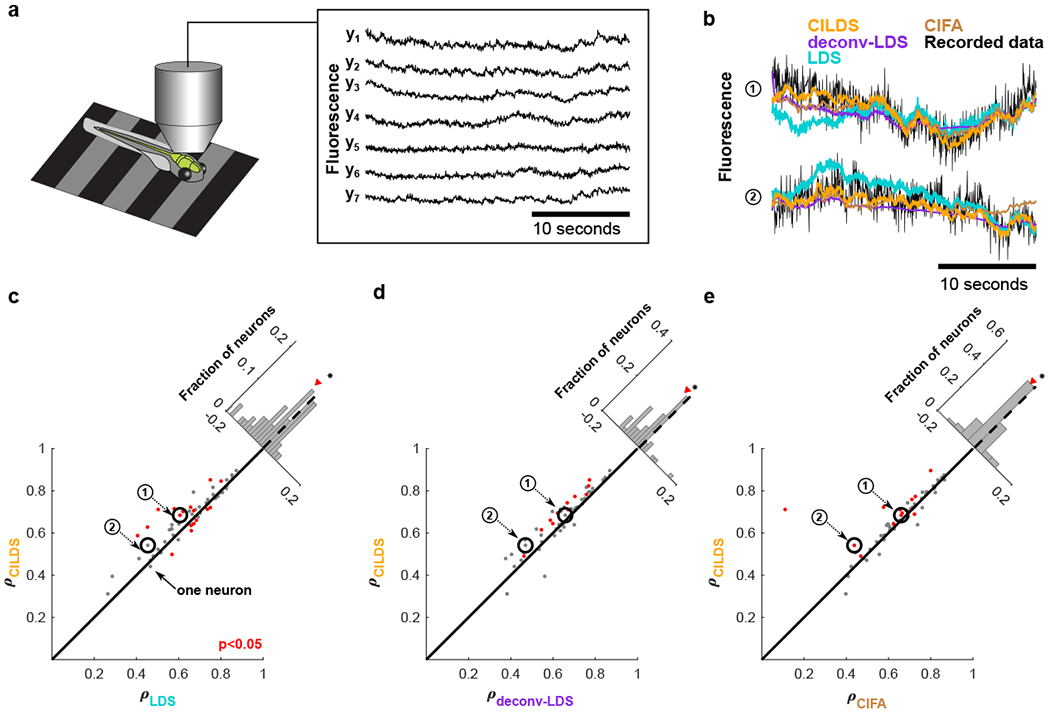
Figure 5: Performance comparison on larval zebrafish DRN recordings.

(a) Two-photon calcium imaging using GCaMP6f at 30Hz was performed on three larval zebrafish in a virtual reality environment. Shown are representative fluorescence traces from seven of the imaged neurons. (b) Example recorded fluorescence traces (black) and leave-neuron-out predicted fluorescence using CILDS (orange), deconv-LDS (purple), LDS (cyan), and CIFA (brown). (c-e) Correlation between the recorded fluorescence and the leave-neuron-out predicted fluorescence for CILDS versus each of the other methods. Each point represents one neuron, where the correlation is computed for each trial (27 seconds long), then averaged across all 15 trials. Diagonal histograms show the paired difference in performance between CILDS and one of the other methods, as indicated. The correlation is higher for CILDS than (c) LDS (p = 0.0001, n = 60 neurons, paired two-tailed t-test across the population of neurons, black asterisk indicating statistical significance), (d) deconv-LDS (p = 5.94 × 10⁻⁵, n = 60 neurons), and (e) CIFA (p = 0.046, n = 60 neurons). Note that the histograms are zoomed-in for visual clarity, and therefore the ends of the histograms are not shown. The numbered points (black circles) correspond to the examples shown in panel b. Red points indicate a statistically significant difference per neuron between CILDS and the other method being compared using a paired two-tailed t-test across trials (p < 0.05, see Methods). Note that the threshold used for the t-test means that we might expect 5% of the neurons to appear significant even if the effect is not real.
