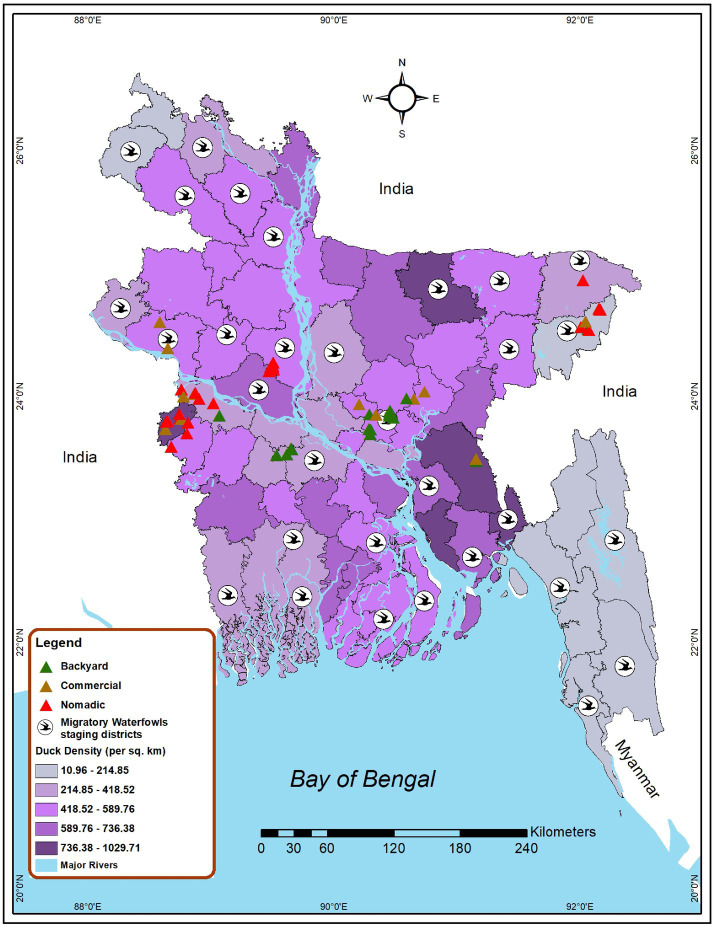
Figure 1.
Map locating the site selected for investigating AIV risk analysis among duck farms in Bangladesh (2019–2021). Green triangles represent backyard duck farms, brown triangles represent commercial duck farms, and red triangles represent nomadic duck farms chosen for sampling in this study. Bird symbols denote districts that have migratory bird staging areas. The intensity of the color gradient shows the density of ducks in a district.

