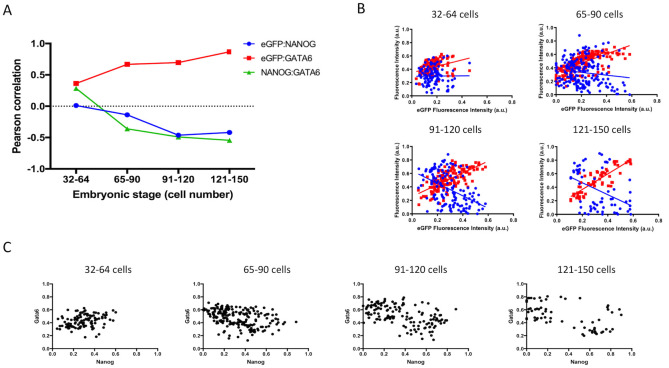
Fig 3. Correlation of FGFR2-eGFP, NANOG and GATA6 based on cell number.
A) Graphic representation of Pearson correlation values observed in embryos with 32 to 64 cells (n = 111 cells), 65 to 90 cells (n = 196), 91–120 cells (n = 139) and 121–150 cells (n = 65). Blue dots represent eGFP and NANOG correlation, red squares represent eGFP and GATA6 correlation and green triangles represent NANOG and GATA6 correlation. B) Graphic representation of linear regression analysis of fluorescence intensity levels. Blue dots and blue line represent NANOG cell measurements and regression analysis considering NANOG and eGFP levels respectively. Red dots and red line represent GATA6 cell measurements and regression analysis considering GATA6 and eGFP levels respectively. C) Dot plots depicting measured levels of NANOG and GATA6 in individual cells.

