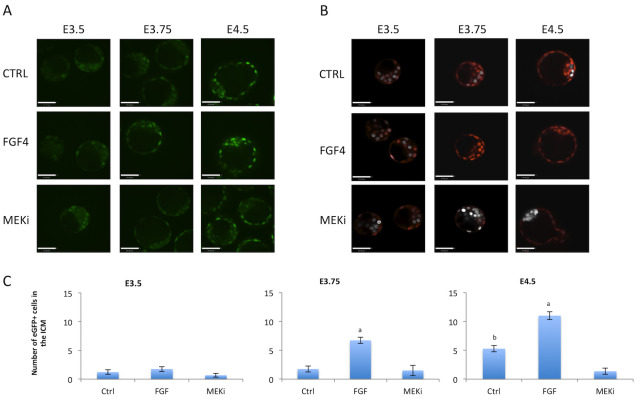
Fig 4. Treatment of FGFR2-eGFP embryos with FGF4 or ERK inhibitor.
A) Representative images of live imaged FGFR2-eGFP embryos at different embryonic days and consequently different exposure to treatment. Scale bar is equal to 47μm. B) Representative images of embryos immunostained for NANOG (grey) and GATA6 (red) at different embryonic days and consequently different exposure to treatment. Scale bar is equal to 47μm. C) Graphical display of GFP cell counts in the ICM at E3.5, E3.75 and E4.5. Letters within each timepoint indicates statistical significance, "a" indicates significant differences from all other groups and "b" indicates significant differences from MEKi group. E3.5 Control n = 9 embryos, FGF4 n = 8, MEKi n = 12; E3.75 Control n = 12, FGF4 n = 11, MEKi n = 4; E4.5 Control n = 12, FGF4 n = 8, MEKi n = 10.

