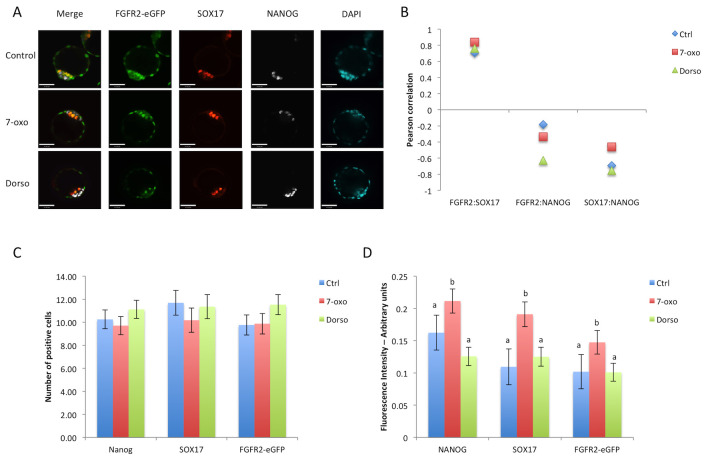
Fig 6. Treatment of FGFR2-eGFP embryos with BMP signaling inhibitors.
A) Representative images of embryos from each treatment group at E4.5 after immunostaining for eGFP (green), NANOG (grey) and SOX17 (red). Scale bar is equal to 47μm. B) Graphic representation of Pearson correlation values between eGFP, NANOG and SOX17 after BMP inhibitor treatments. Blue lozenges represent values from control group, red squares represent values from 7- oxo treated group and green triangles represent values from dorsomorphin treated embryos. C) Graphic representation of cell counts in E4.5 embryos after different treatments. D) Graphic representation of quantitative image analysis after immunostaining of eGFP, NANOG and SOX17. Different superscript letters (a,b) denote significant statistical differences between groups. Control n = 64 cells, 7-oxo n = 61 cells, Dorso n = 67 cells.

