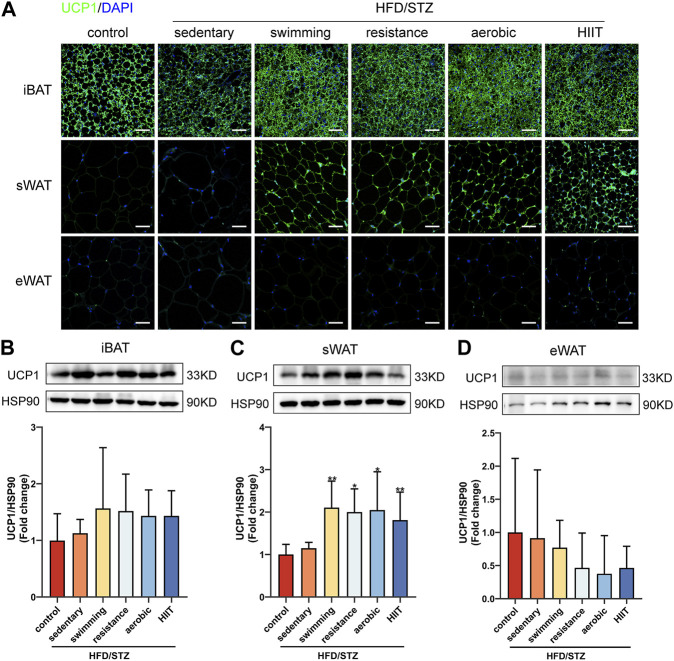
FIGURE 6.
The effects of exercise training on UCP1 protein levels. (A) UCP1 immunofluorescence staining of iBAT, sWAT and eWAT from control and HFD/STZ mice (magnification: ×200, scale bar:50 μm). Western blot analysis and quantification for UCP1 using the total protein isolated from iBAT (B), sWAT (C) and eWAT (D) for control and HFD/STZ mice. The protein content is expressed fold change to the control. All data are normalized to HSP90 and are expressed as mean ± SD (n = 6 for each group). vs. sedentary group: *p < 0.05, **p < 0.01.

