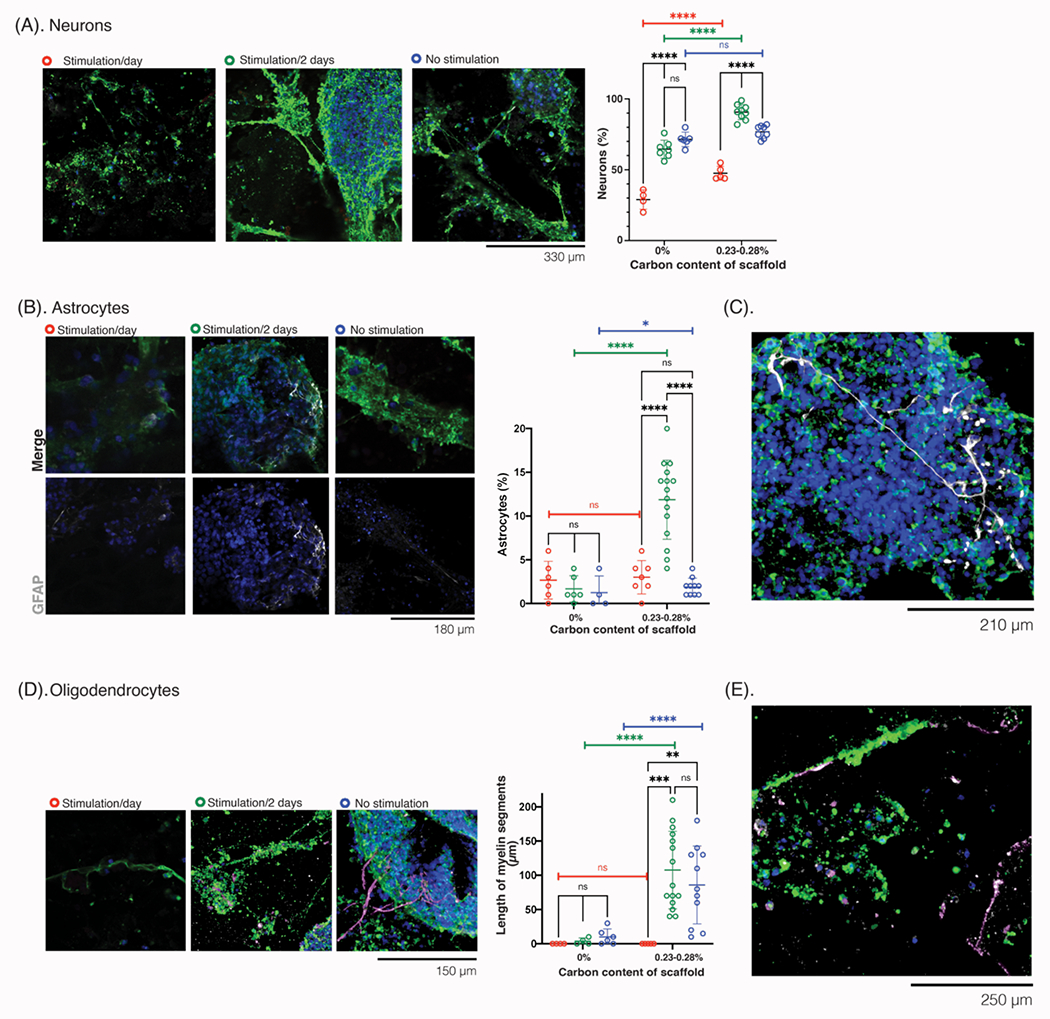
Figure 10: Evaluation of neurons, astrocytes, and oligodendrocytes after exogenous electrical stimulation of NPC-laden scaffolds.

(A) Photomicrographs of the cells at 51 days in vitro (DIV), after following the stimulation paradigm for the first 8 days of culture, and stained for neuronal markers. Tuj1 (green), NPC (red), Hoescht (blue). Scale bar: 330 μm. Quantification (right) of neurons in the cultures (%), across each stimulation condition. (B) Photomicrographs of the cells at 51 DIV, after receiving 8 days of the stimulation paradigm, stained for astrocytic and neurite markers. Top row: merged images, Tuj1 (green), GFAP (white), NPC (red), Hoescht (blue); bottom row: GFAP and Hoescht, only. Scale bar: 180 μm Quantification (right) of the astrocytes (%) in the cultures, comparing different scaffold carbon content and different stimulation paradigms (daily: red, green: every 2 days, blue: no stimulation). (C) Photomicrograph of cells at 51 DIV, after receiving stimulation every other day in the first 8 days, to show the size and distribution of astrocytes over a larger field of view. Tuj1 (green), GFAP (white), NPC (red), Hoescht (blue). Scale bar: 210 μm. (D) Photomicrographs of cells at 51 DIV, after receiving 8 days of the stimulation paradigm, and stained for oligodendrocyte and neurite markers. Tuj1 (green), MBP (white-magenta), NPC (red), Hoescht (blue). Quantification (right) of length of myelin (μm) in each condition for different stimulation paradigms (daily: red, green: every 2 days, blue: no stimulation). (E) Photomicrograph of cells at 51 DIV, after receiving stimulation every other day in the first 8 days, to show the size and distribution of myelination in a smaller field of view. Tuj1 (green), MBP (white-magenta), NPC (red), Hoescht (blue). Scale bar: 250 μm. All numerical data are presented as mean ± s.d. (one-way analysis of variance (ANOVA) and Tukey’s honestly significant difference (HSD) post hoc test: ***P < 0.0001, 0.0001 < ***P < 0.001, 0.001 < **P < 0.01, 0.01 < *P < 0.05, non-significant (n.s.) P > 0.05).
