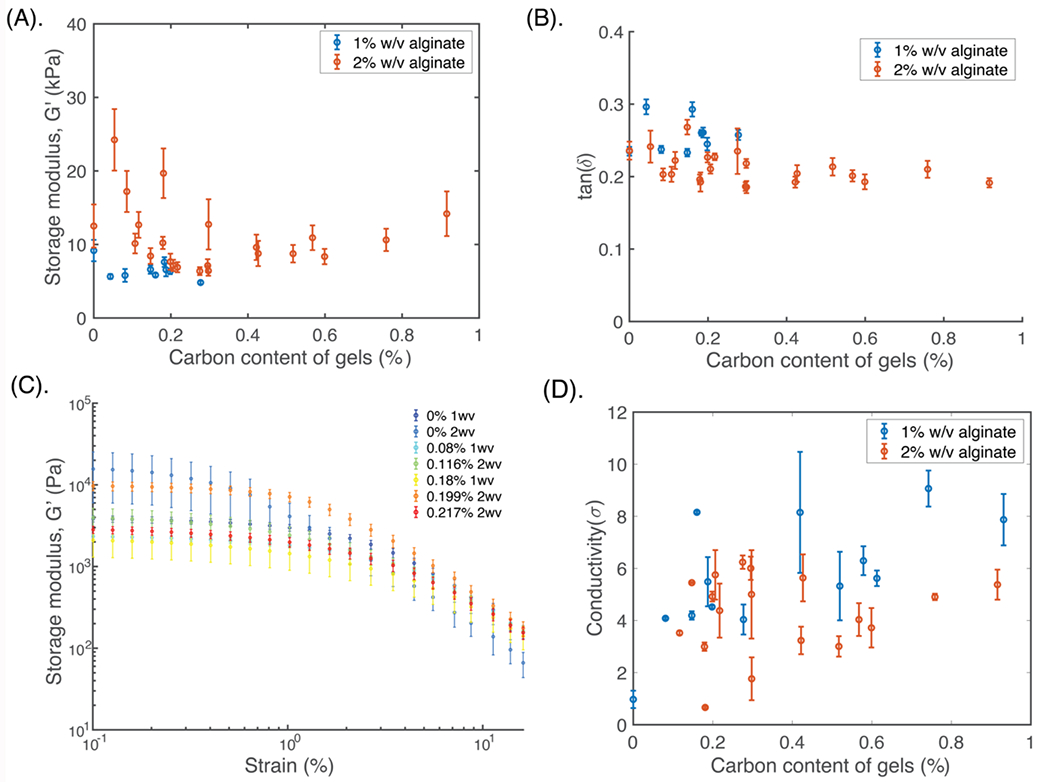
Figure 2: Electrical properties of the scaffold can be adjusted by varying amounts of each carbon nanomaterial, while keeping mechanical properties largely consistent.

(A) Quantification of the storage modulus (G’), and (B) tan(δ) of the scaffolds with varying amounts of total carbon (graphene flakes and carbon nanotubes) using nanoindentation analysis (N=6 independent gels, n>5 measurements per gel). Gels with 1% (blue) and 2% (red) w/v alginate content are compared. Mean and standard error are shown for each graph. (C) Quantification of the bulk G’ versus % strain, with varying amounts of carbon (%) and with either 1% or 2% w/v alginate. N=4 independent gels for each composition. Legend (right) denotes the alginate w/v % of the composite, and the total amount of additive in the scaffold (%). (D) Quantification of gel conductivity with varying amounts of carbon, for 1% (blue) and 2% (red) w/v alginate. N=5 independent gels for each composition, with n>12 measurements per gel. Mean and s.d. are shown for each graph.
